Content-Aware Computation for Optical Microscopy
NIH.AI Workshop: Optical Microscopy
Matthew Guay, NIH/NIBIB
matthew.guay@nih.gov
leapmanlab.github.io/nihai/jan20/
Current applications
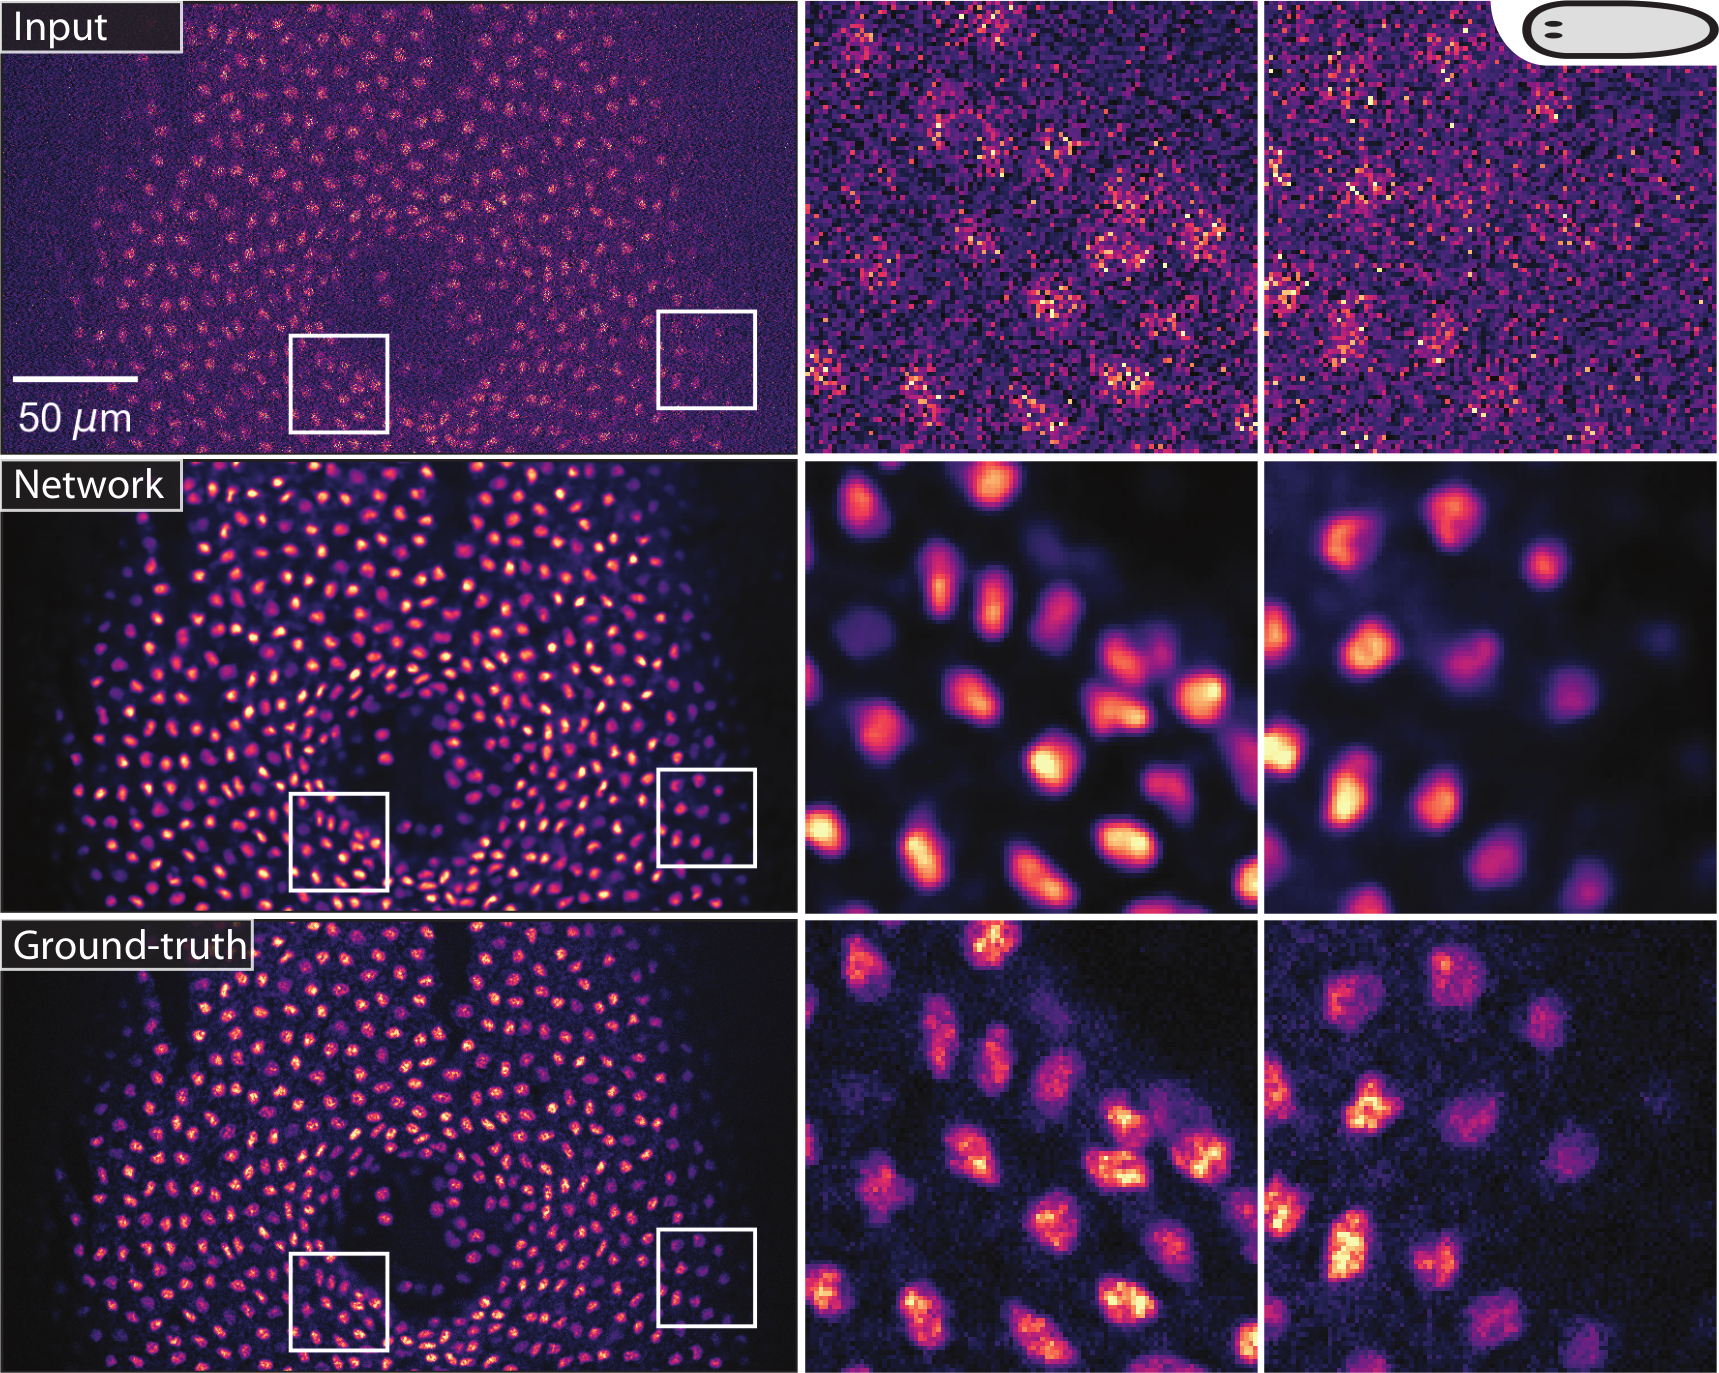
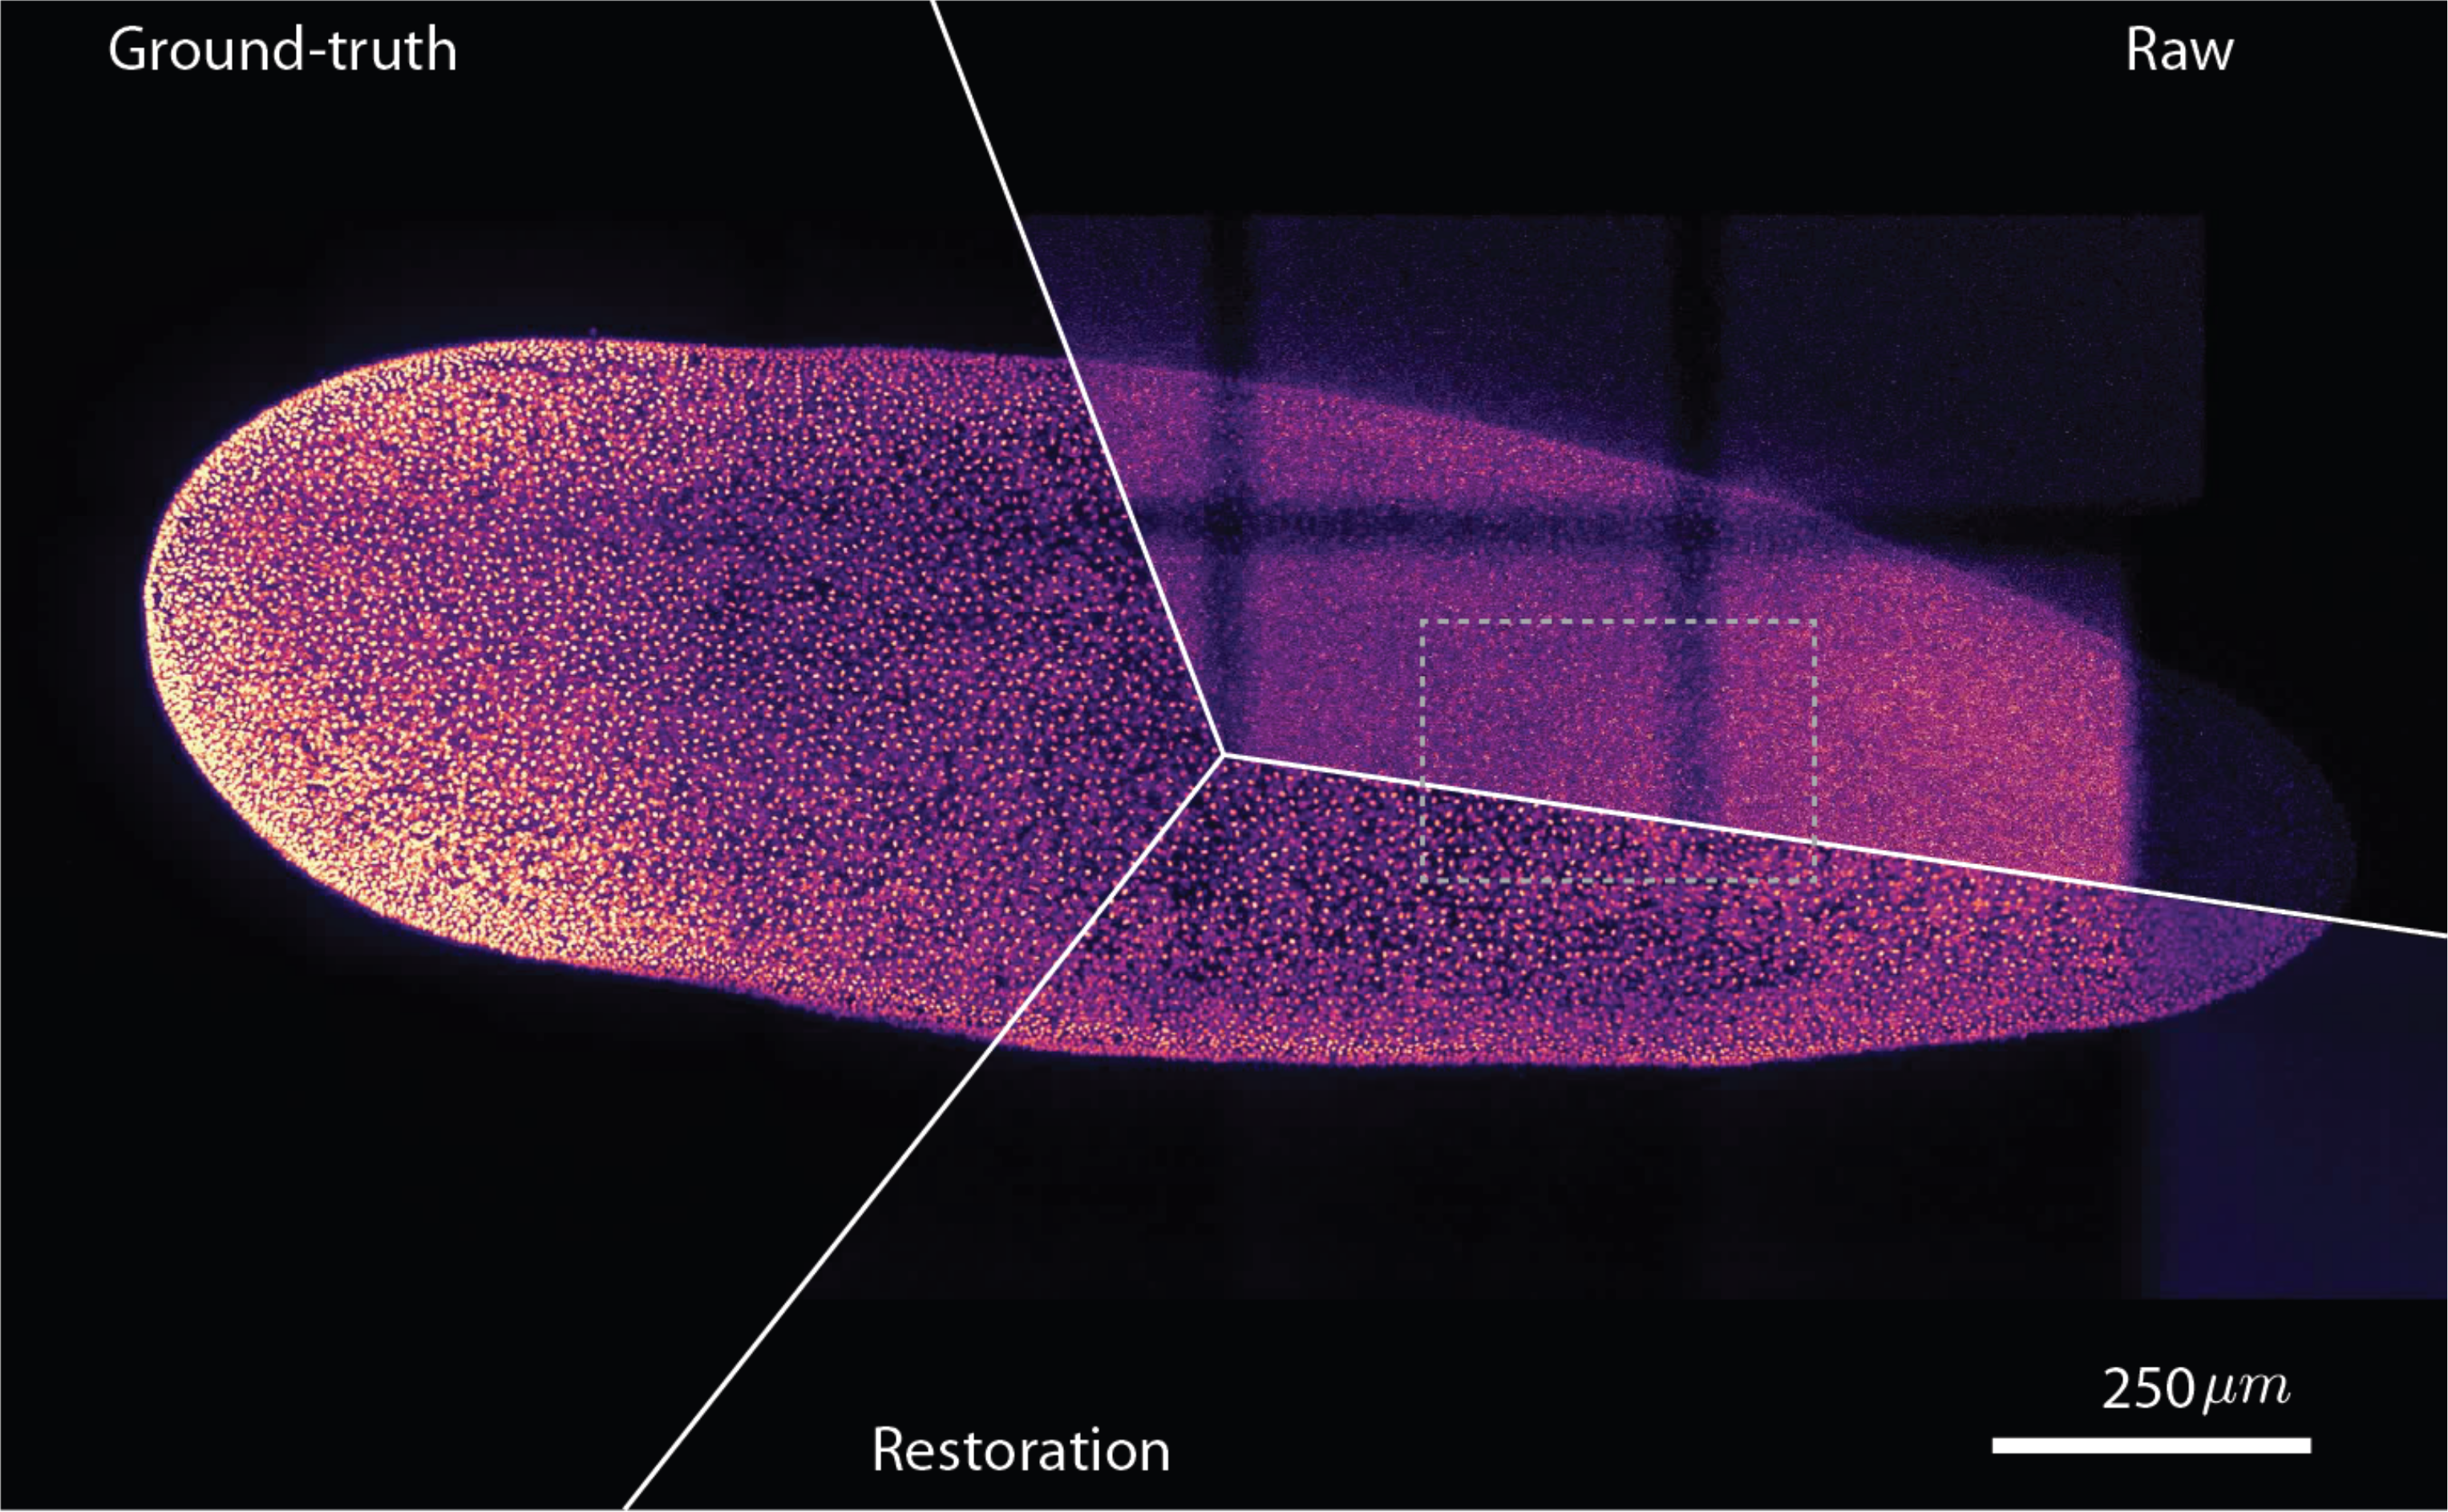
(Weigert et al., 2018). Restoring flatworm stained nuclei from low SNR images.
(Weigert et al., 2018). Medium-zoom comparison between a low-SNR flatworm image, CARE restoration, and high-SNR ground truth.
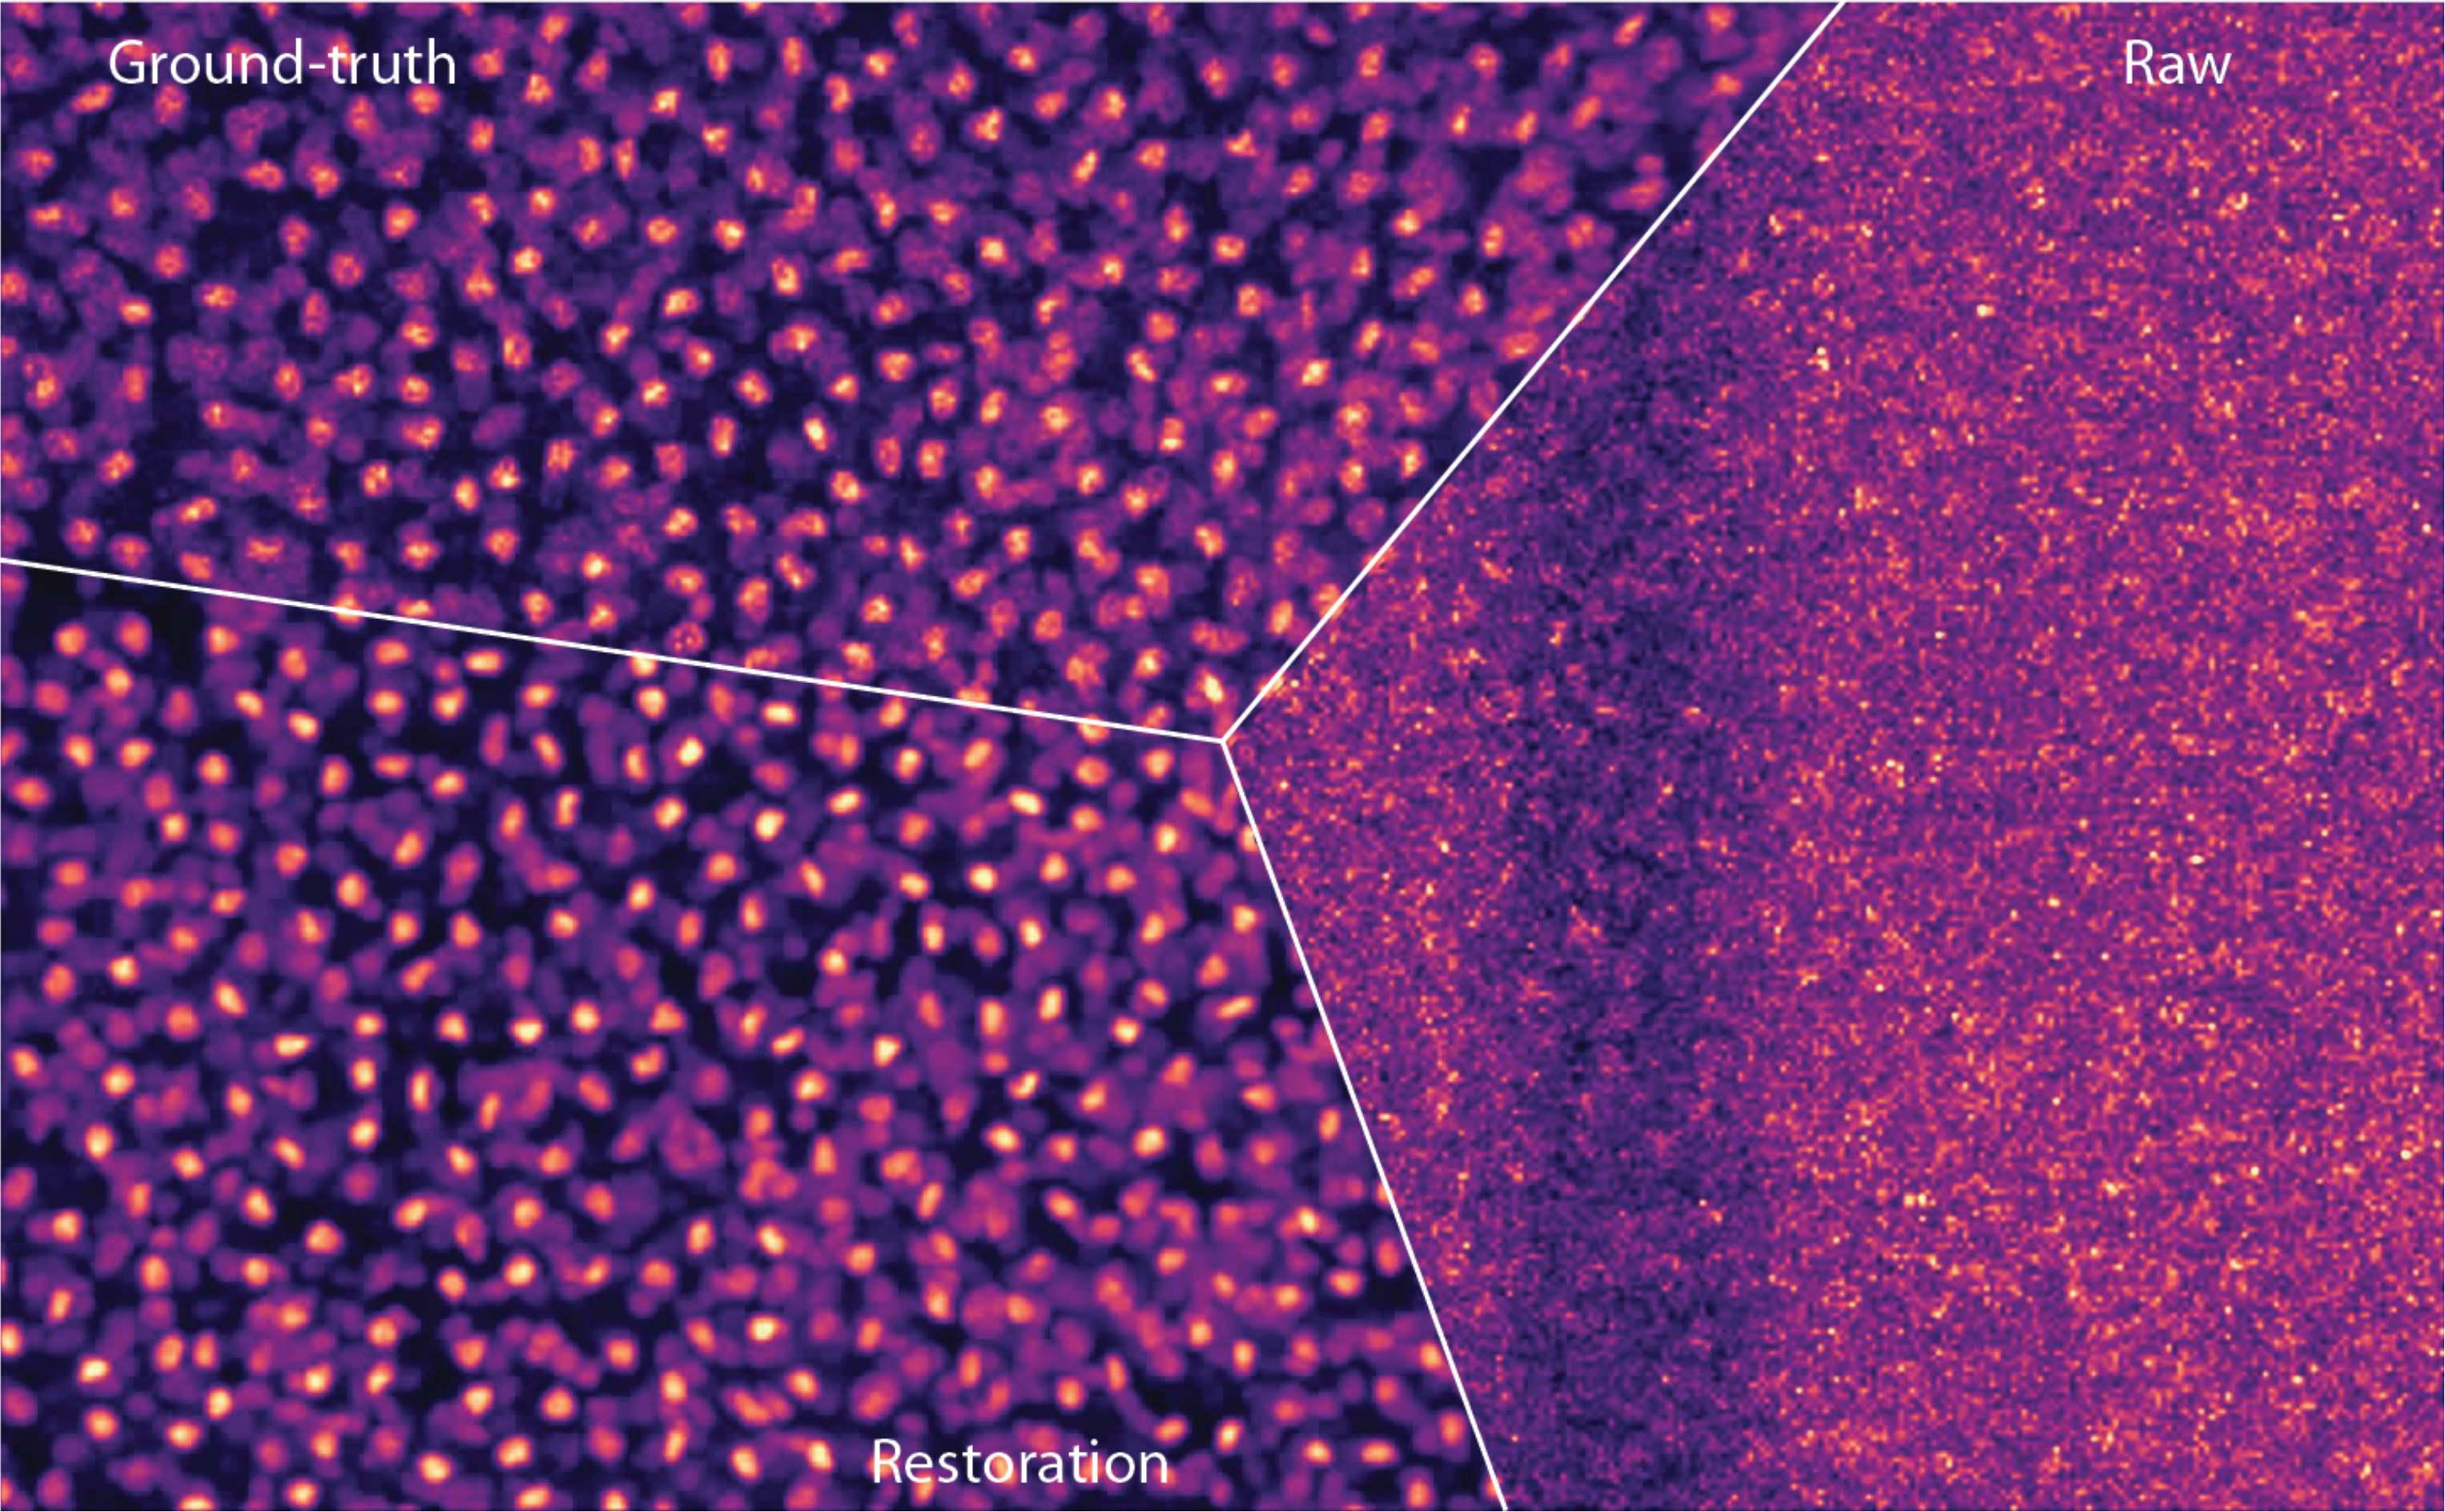
(Weigert et al., 2018). High-zoom comparison between a low-SNR flatworm image, CARE restoration, and high-SNR ground truth.
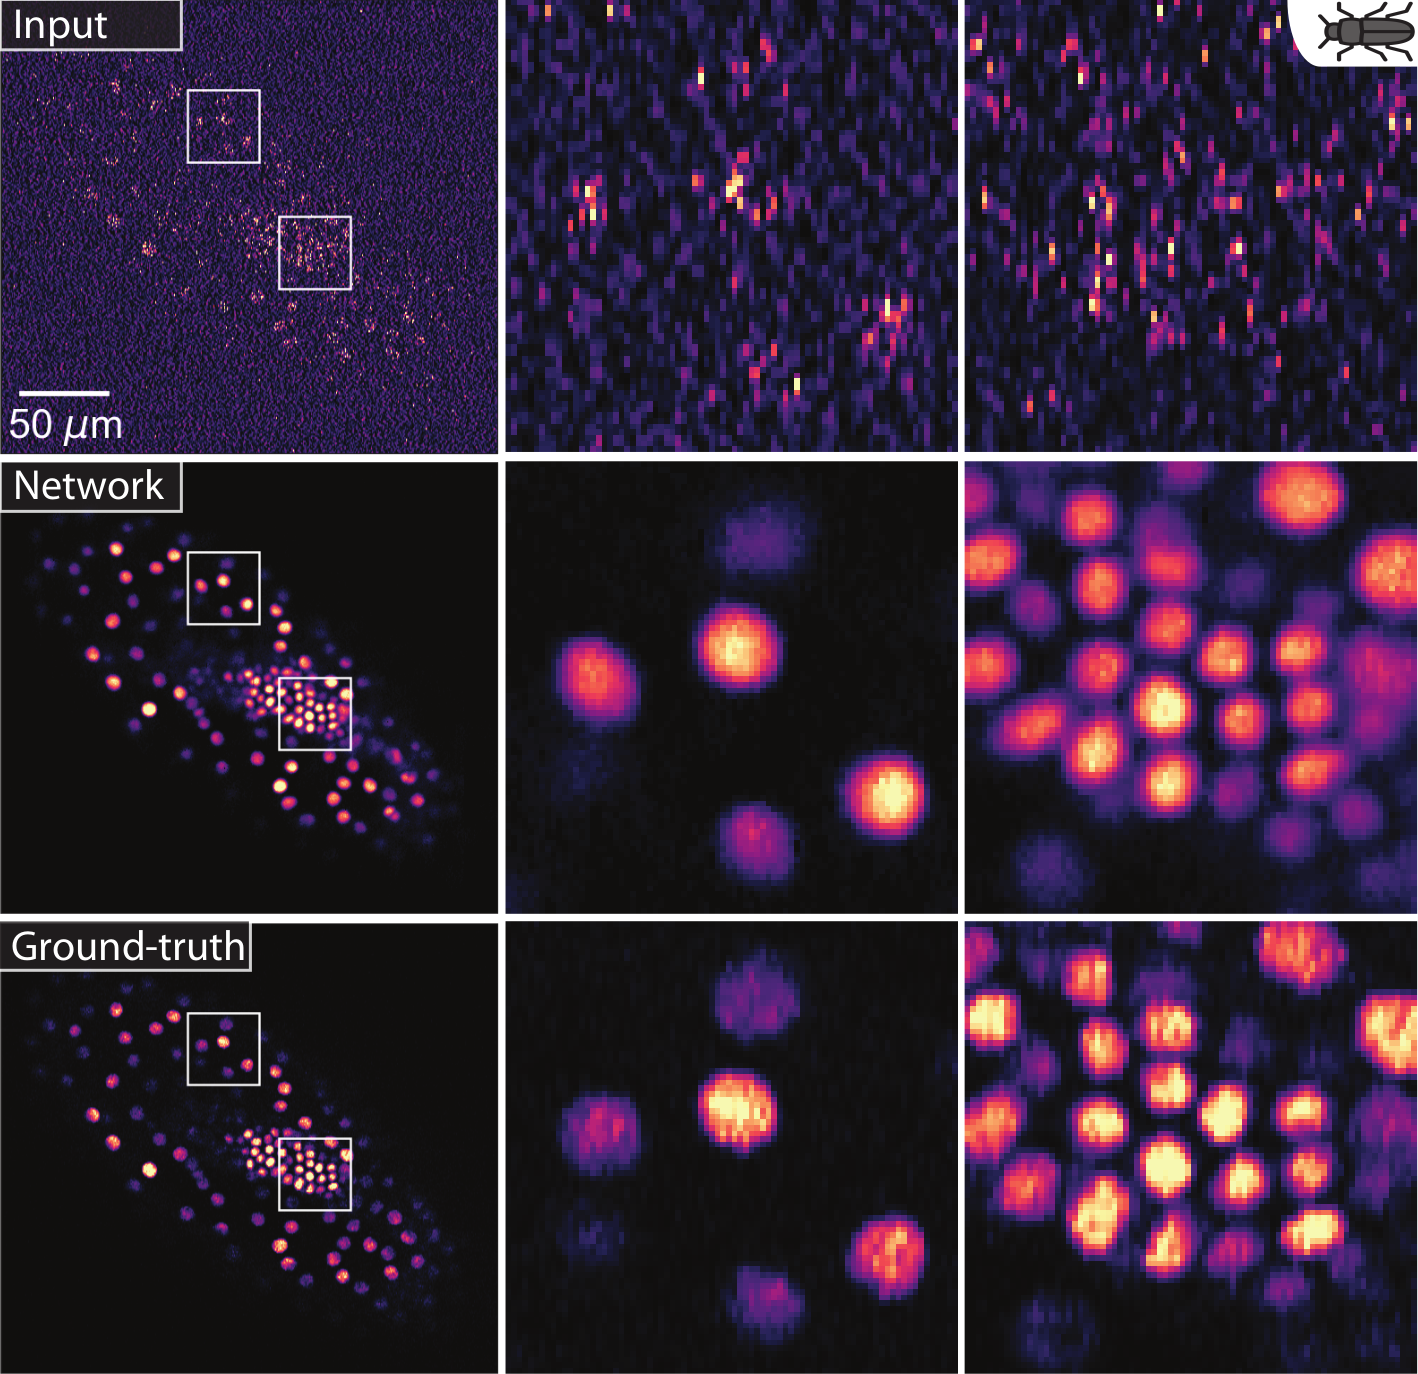
(Weigert et al., 2018). Restoring red flour beetle embryo stained nuclei from low SNR images.
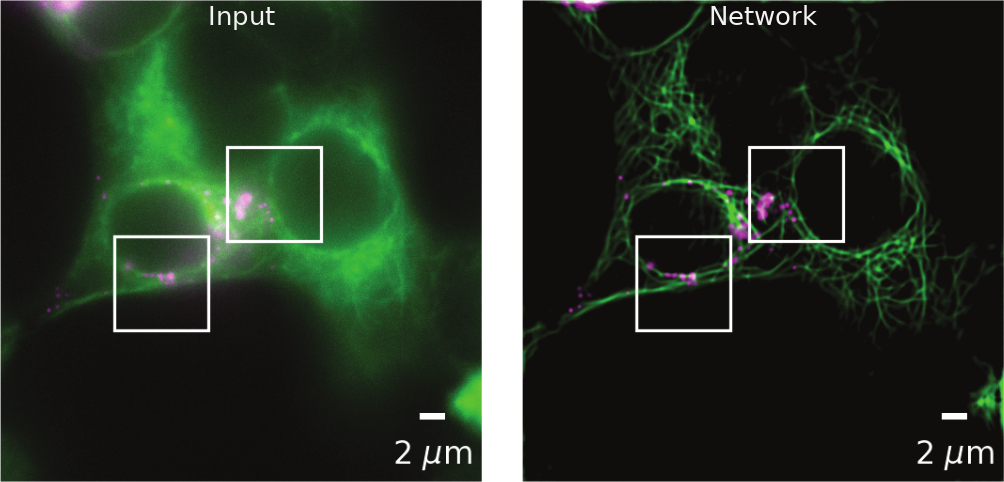
(Weigert et al., 2018). CARE enhancement of diffraction-limited secretory granules and microtubules in rat INS-1 cells.
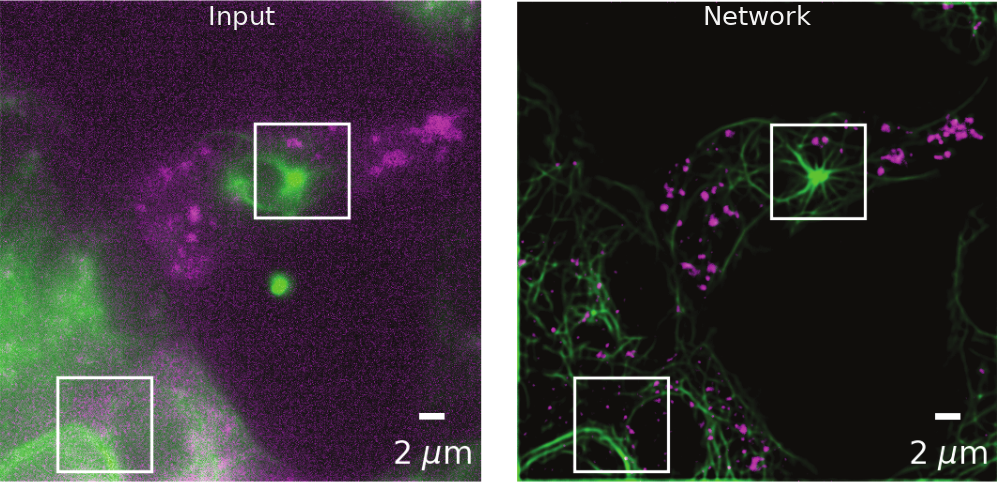
(Weigert et al., 2018). CARE enhancement of diffraction-limited secretory granules and microtubules in rat INS-1 cells.
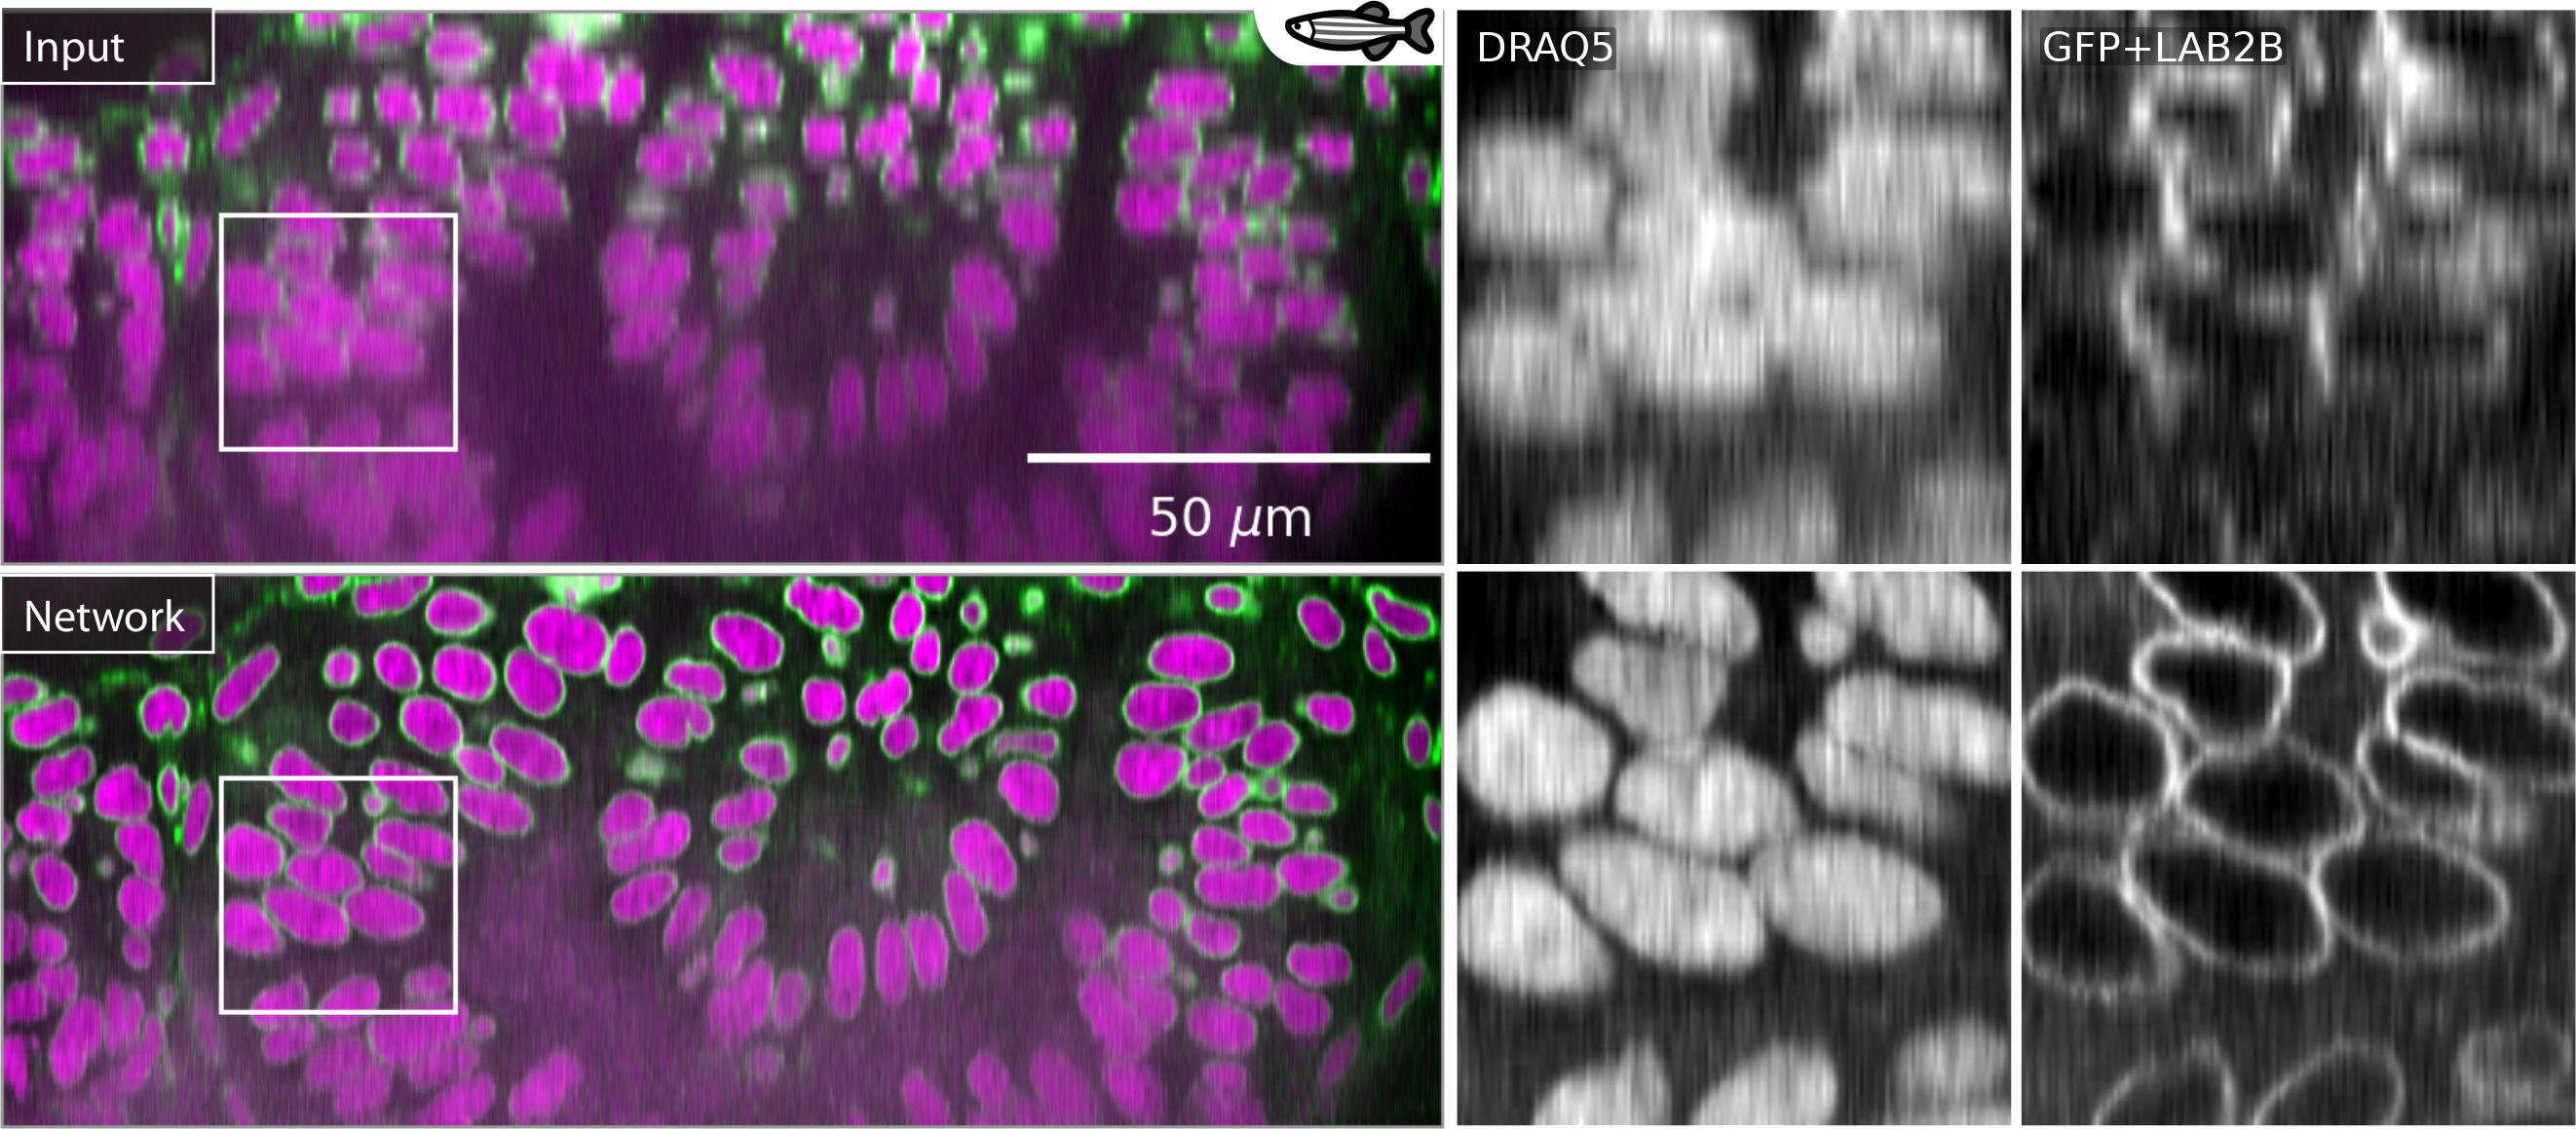
(Weigert et al., 2018). CARE superresolution to correct axial anisotropy in a zebrafish retina image.
Additional superresolution examples from the (Belthangady et al., 2019) review paper.
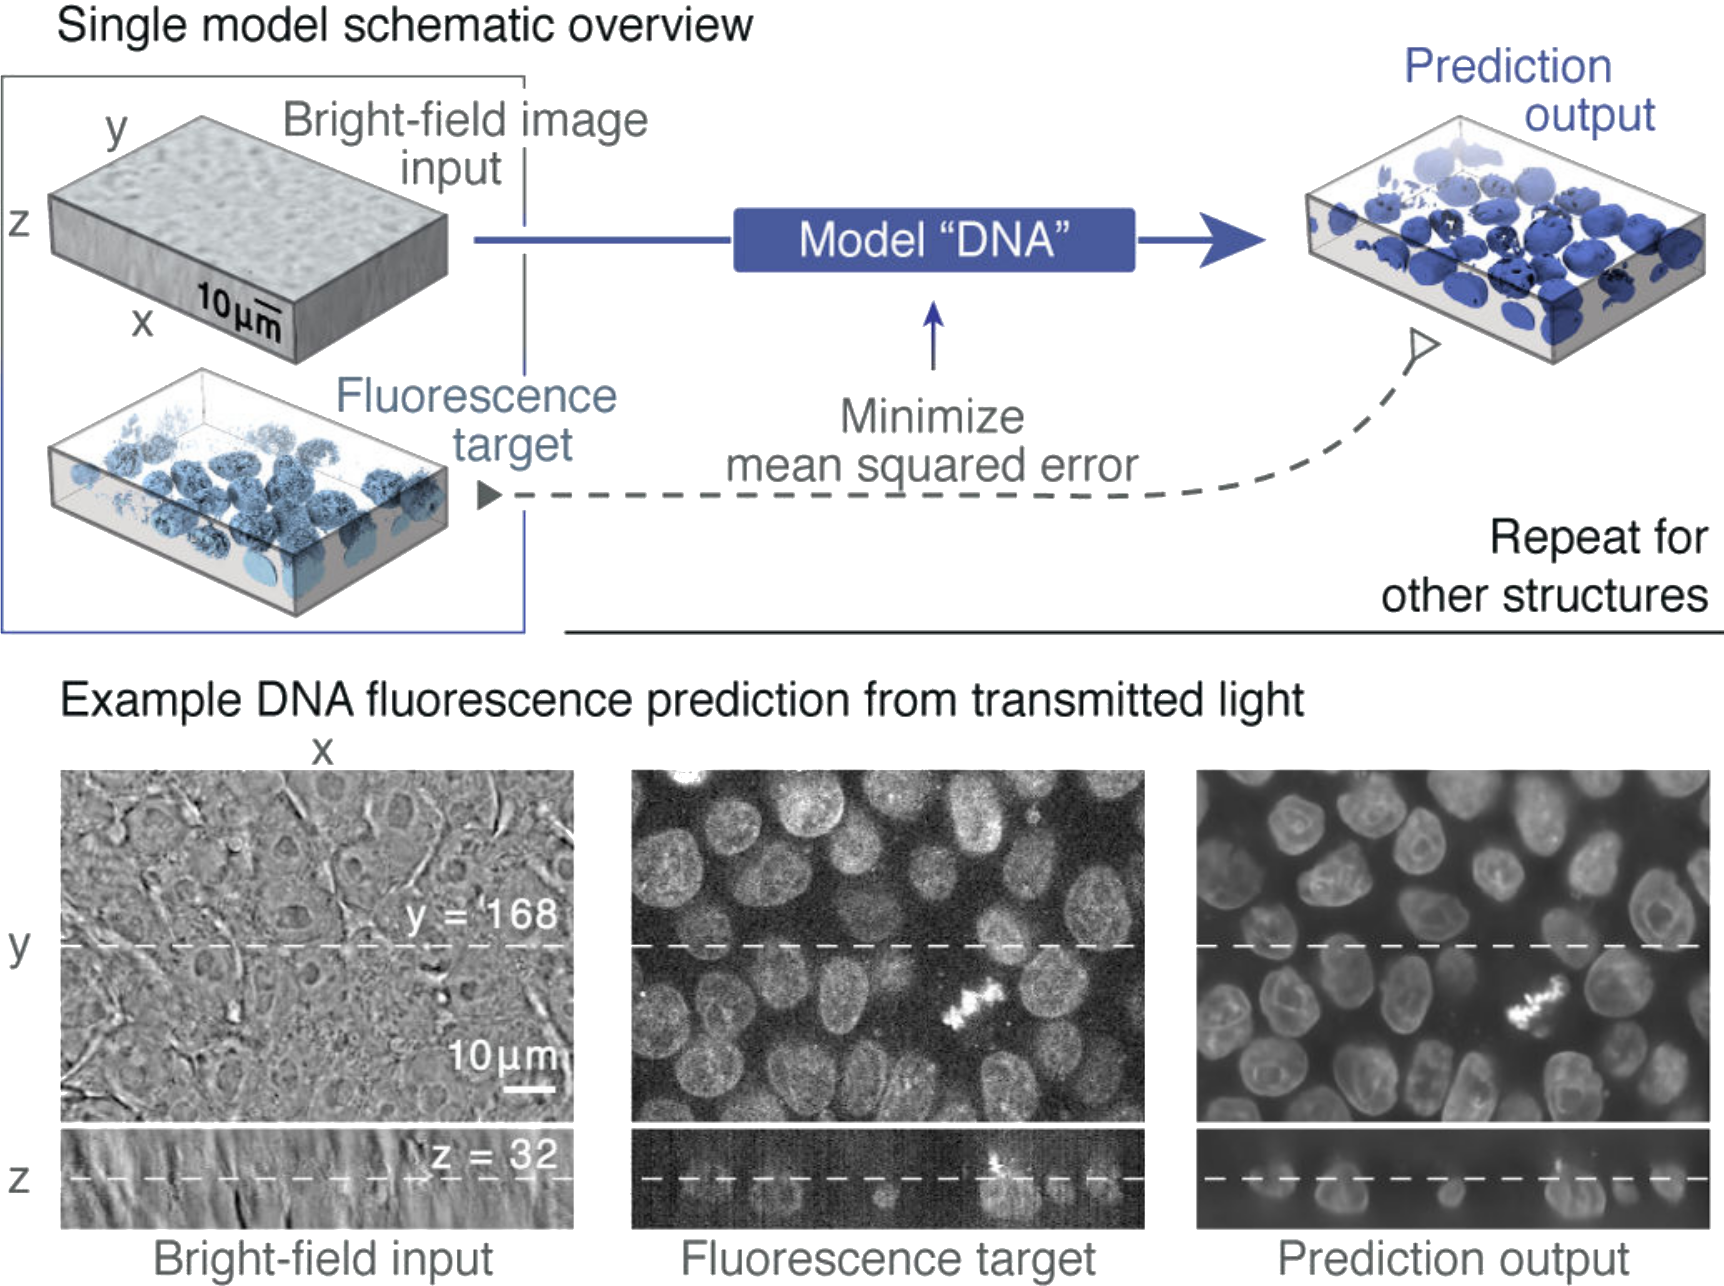
(Ounkomol et al., 2018)[PDF]. Label-free prediction model training on a fluorescence target.
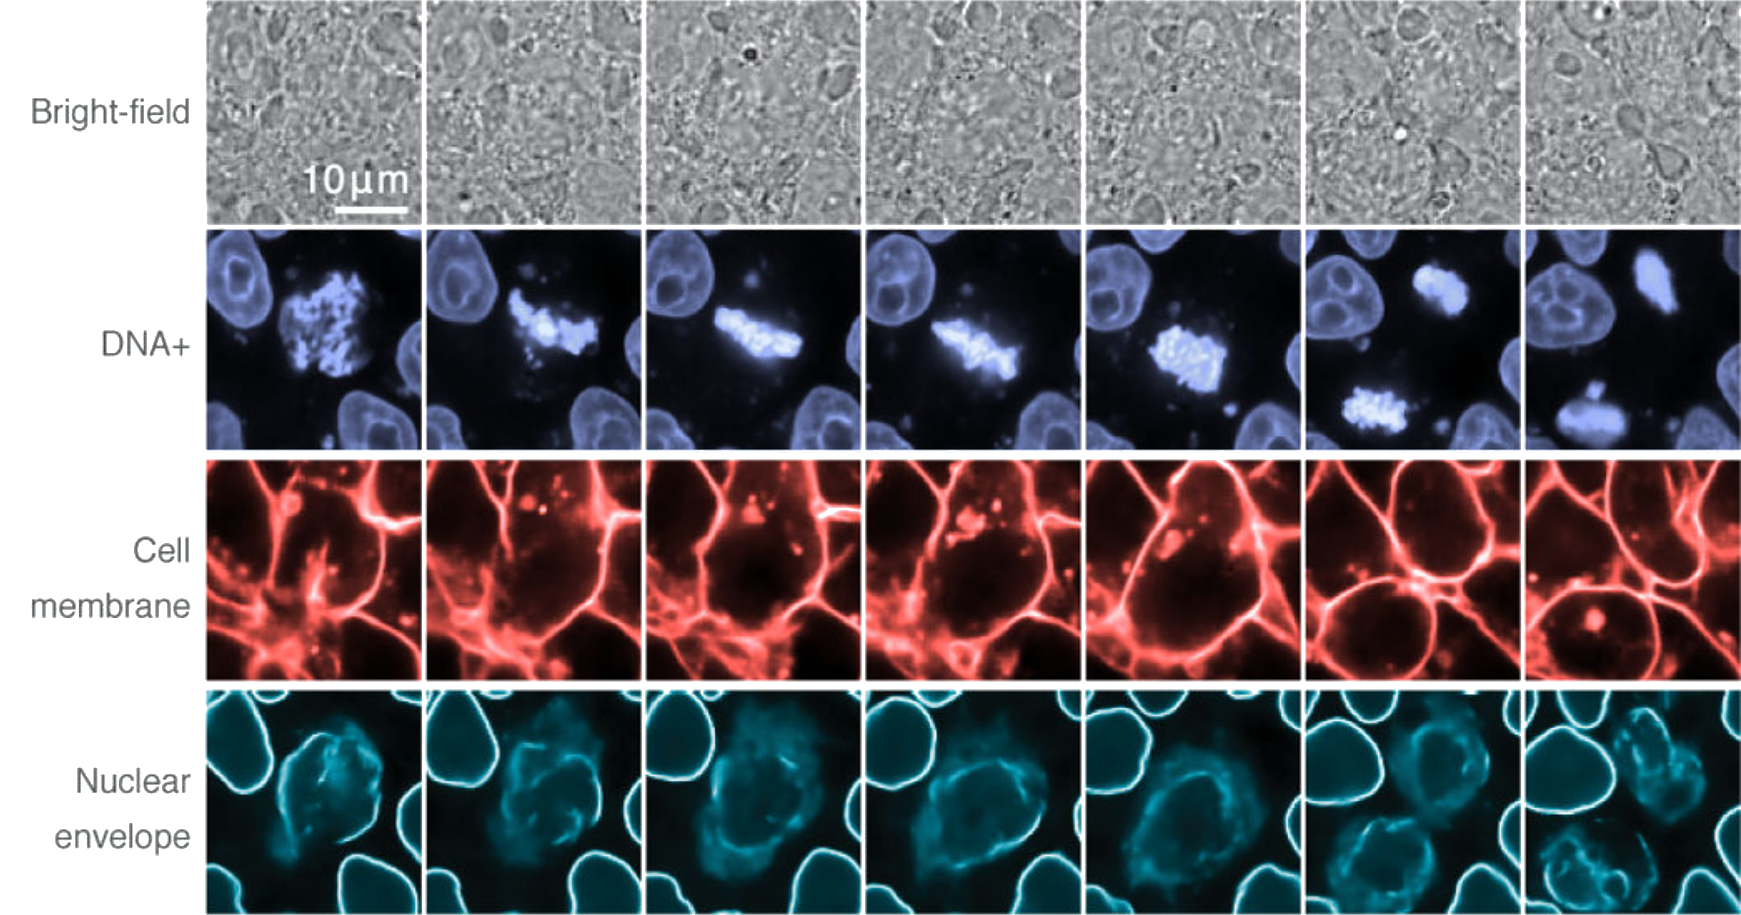
(Ounkomol et al., 2018). Multi-target prediction across a time series by combining individually-trained networks.
Computational tools
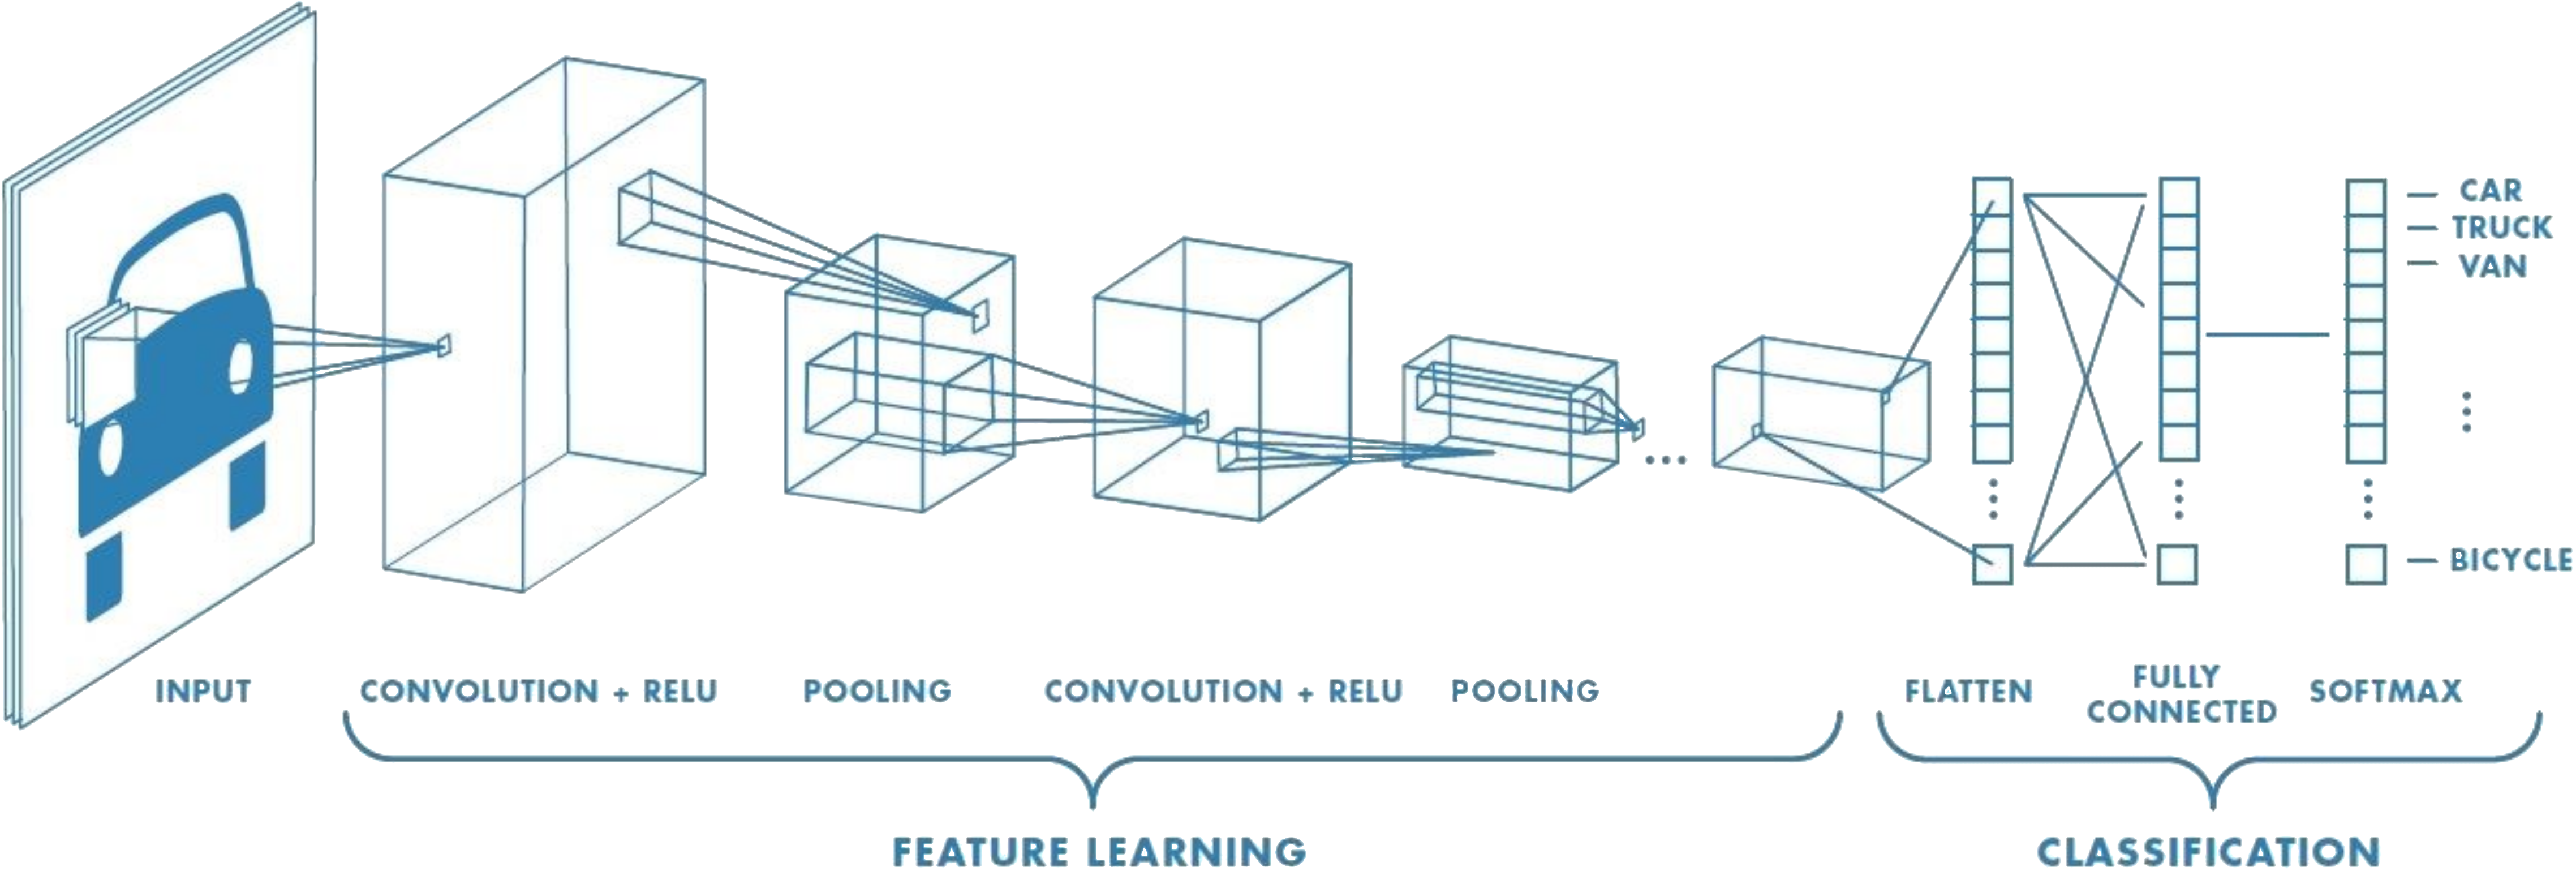
Source. Example of a small CNN architecture. Convolutional features are learned and transformed into classification predictions about image content.
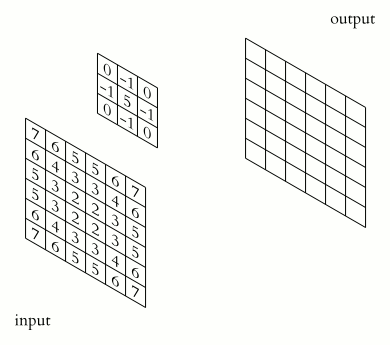
Source. 2D convolution example. A sharpening kernel is applied to an "image".
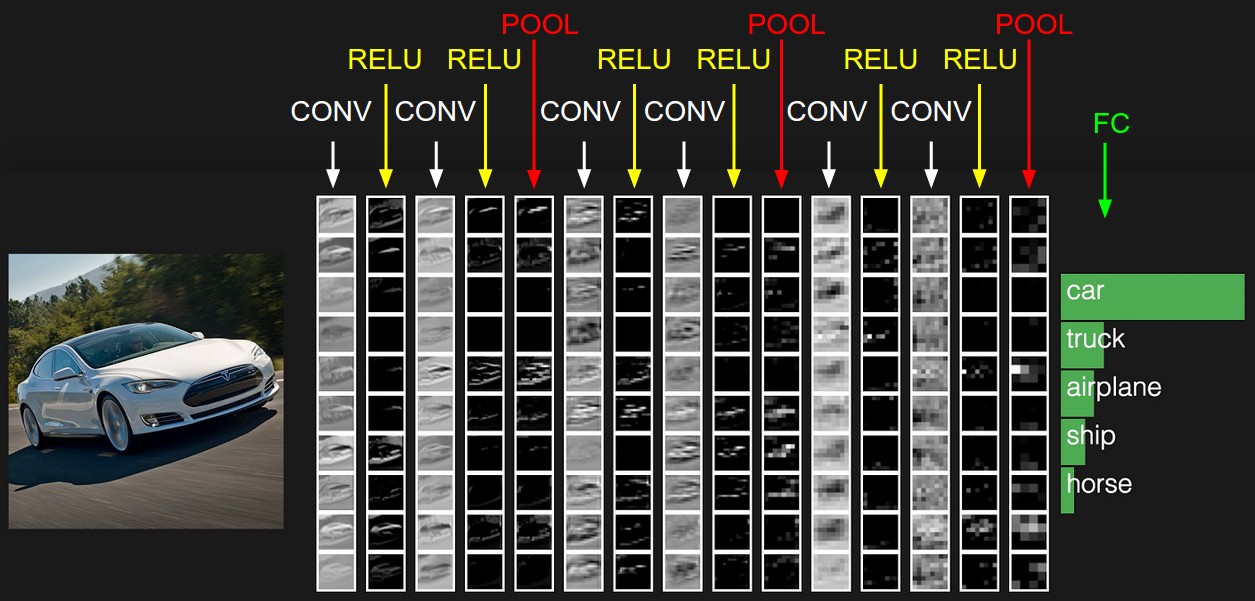
Source. Visualization of layers inside a small image classification CNN.
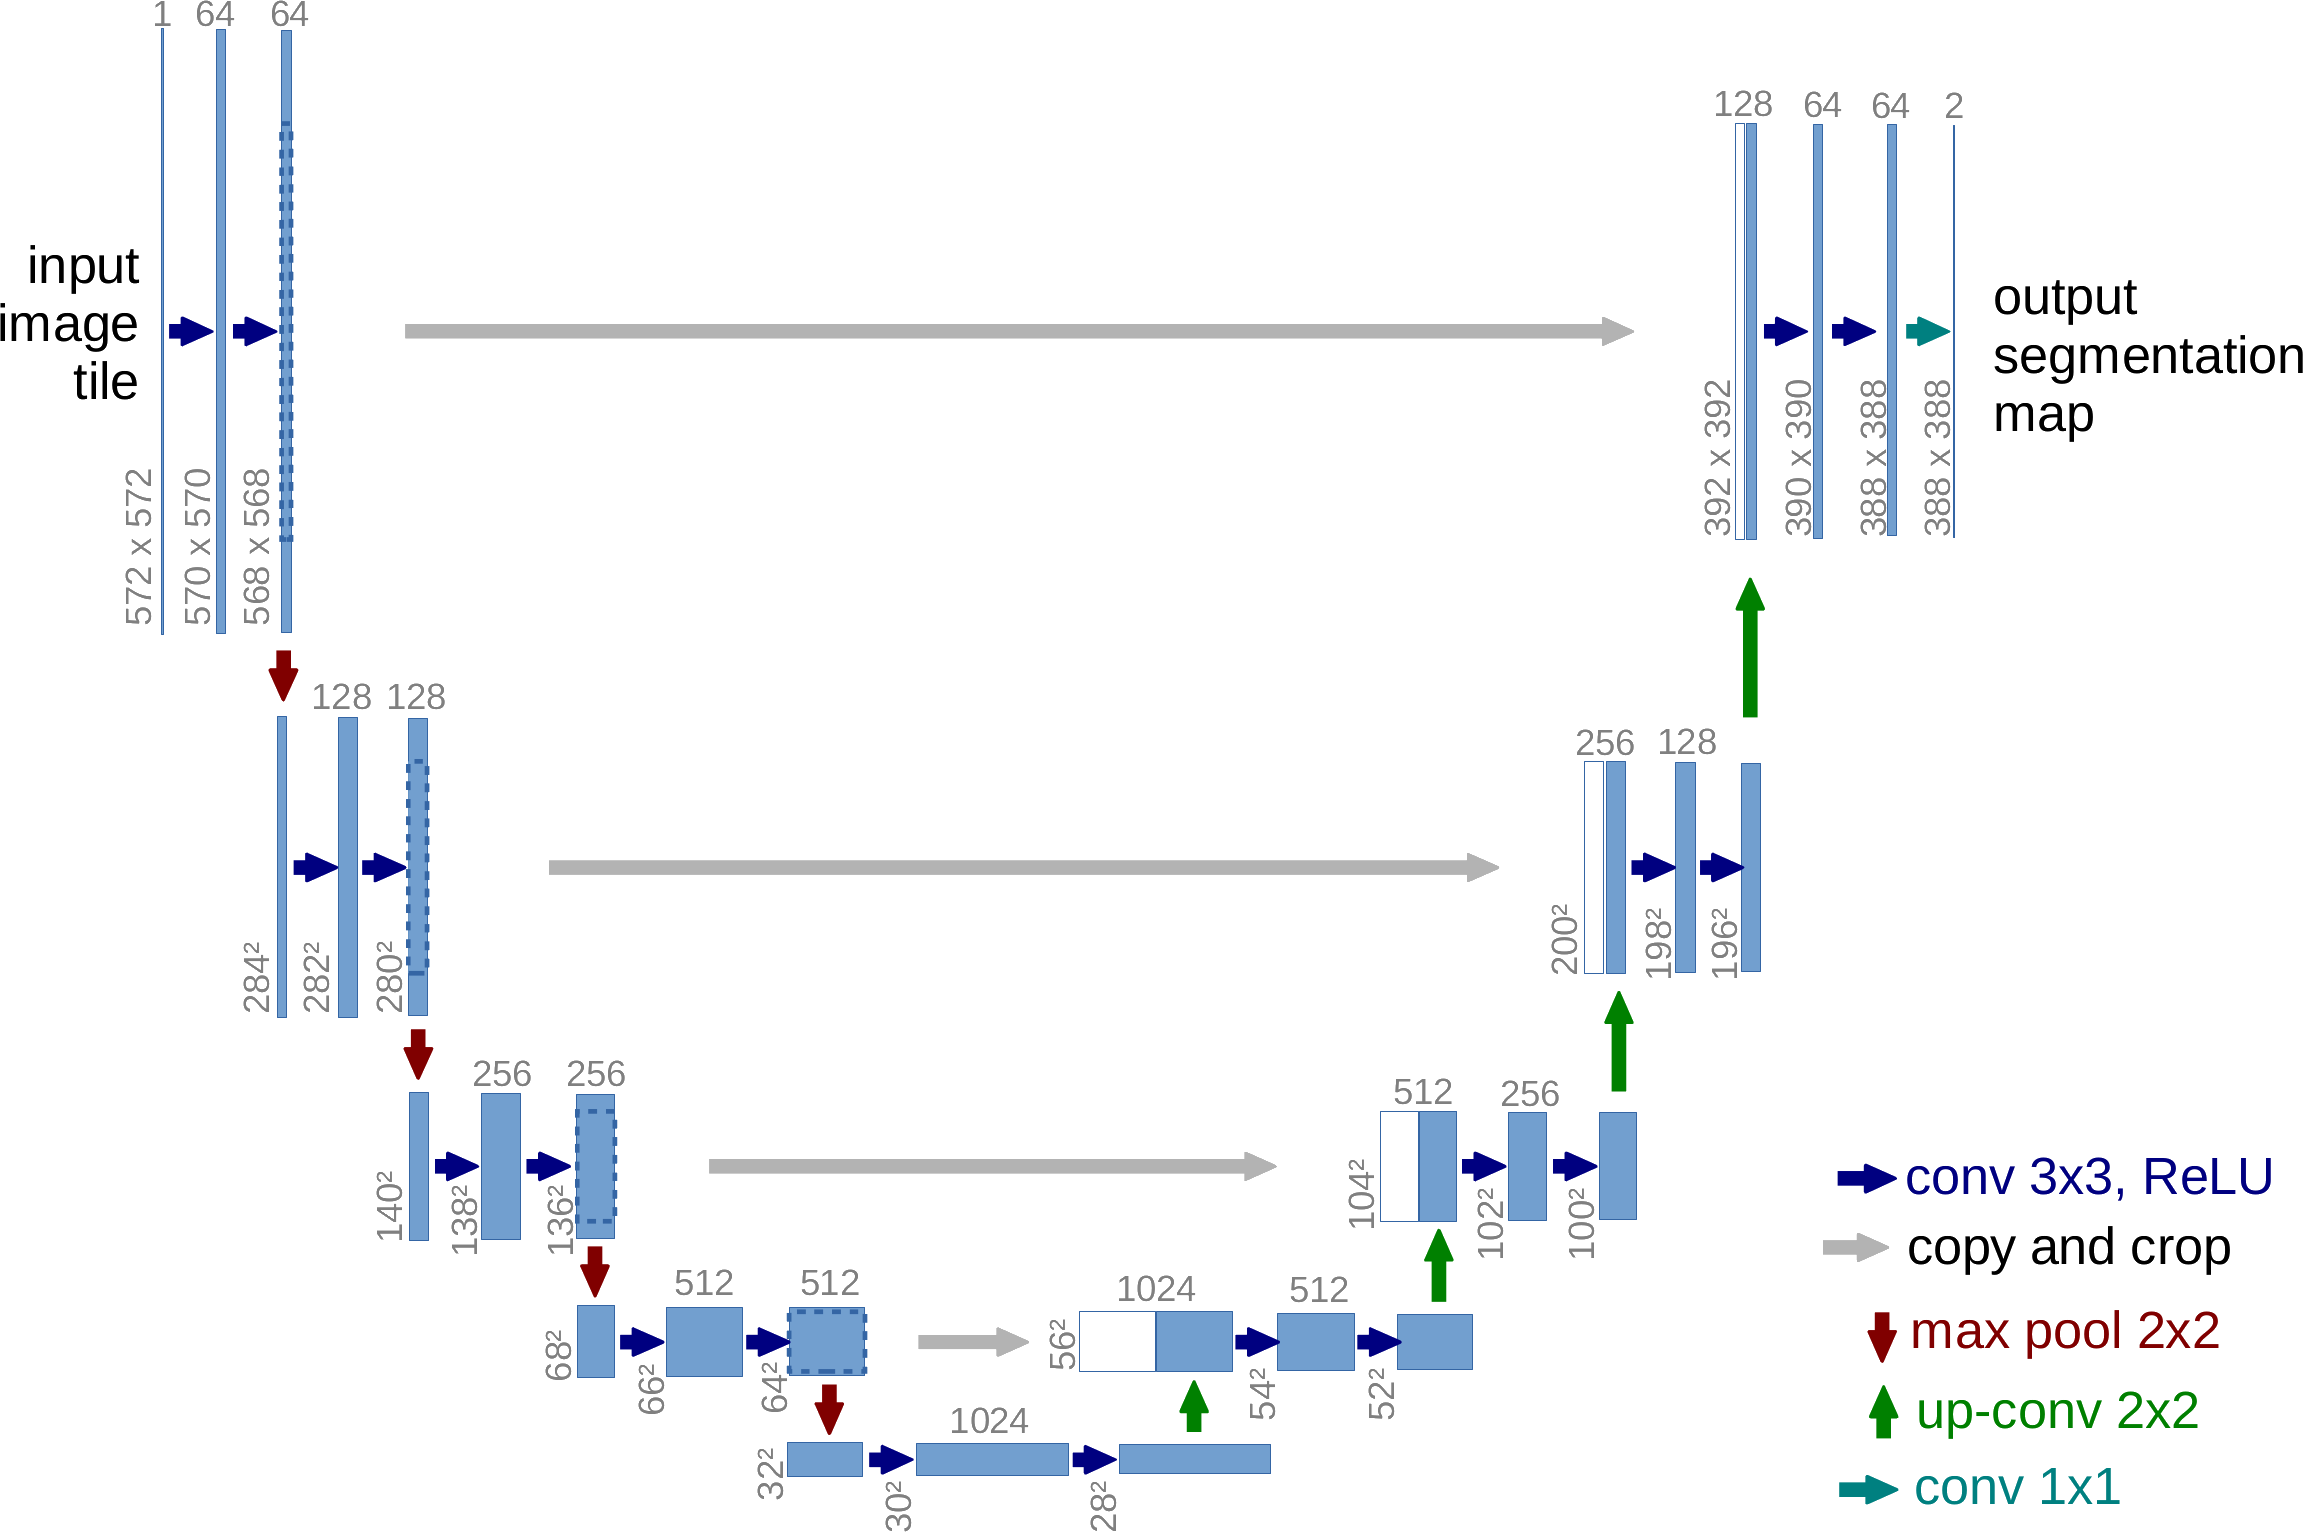
(Ronneberger et al., 2015). Diagram of the original U-Net architecture.
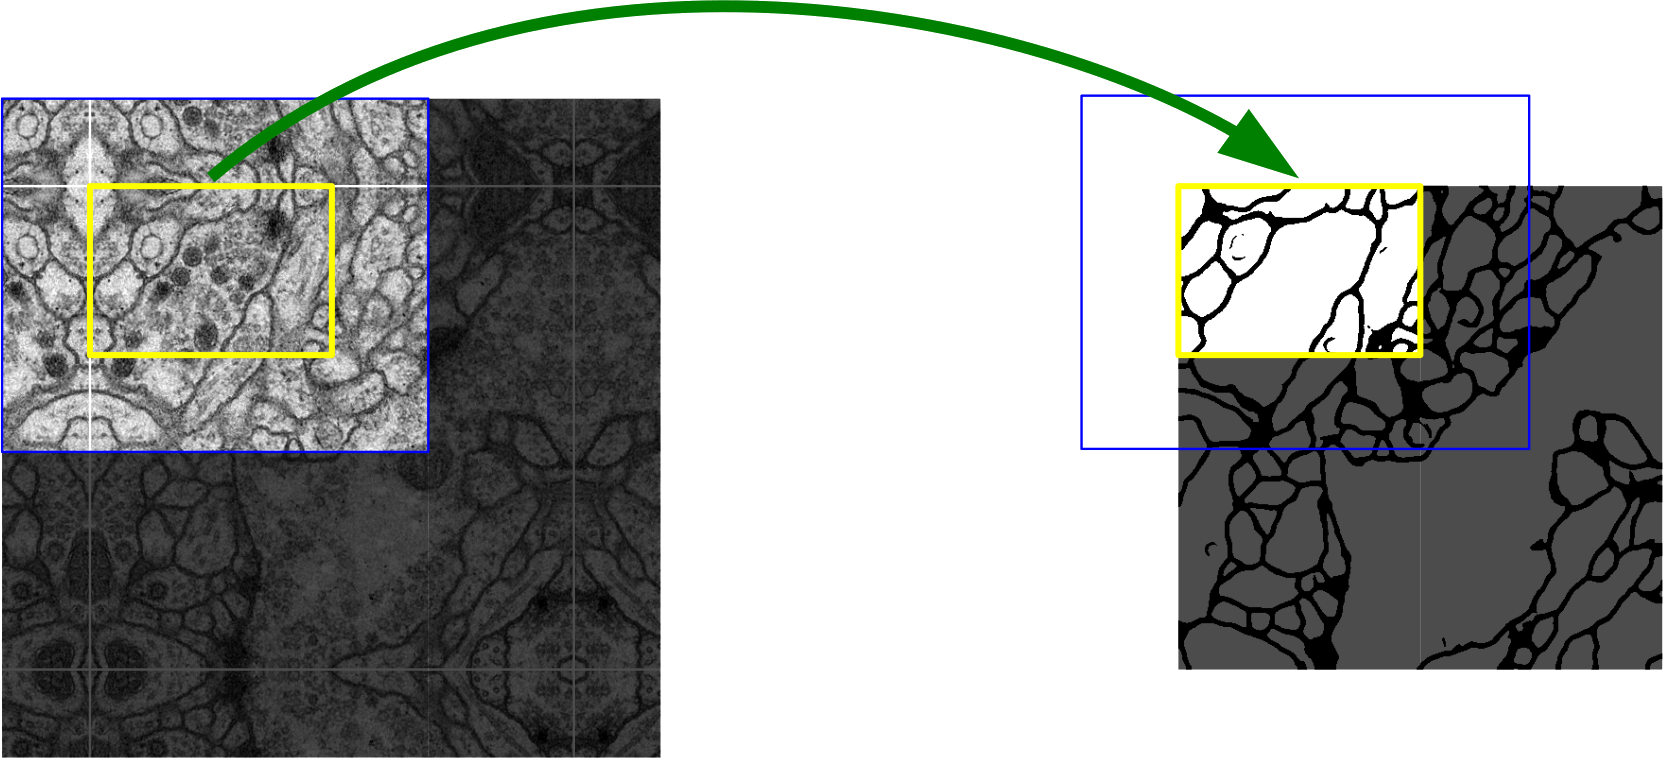
(Ronneberger et al., 2015). Image segmentation example with the U-Net. Blue input tiles provide spatial context for yellow output tiles. Large images can be segmented tile by tile.
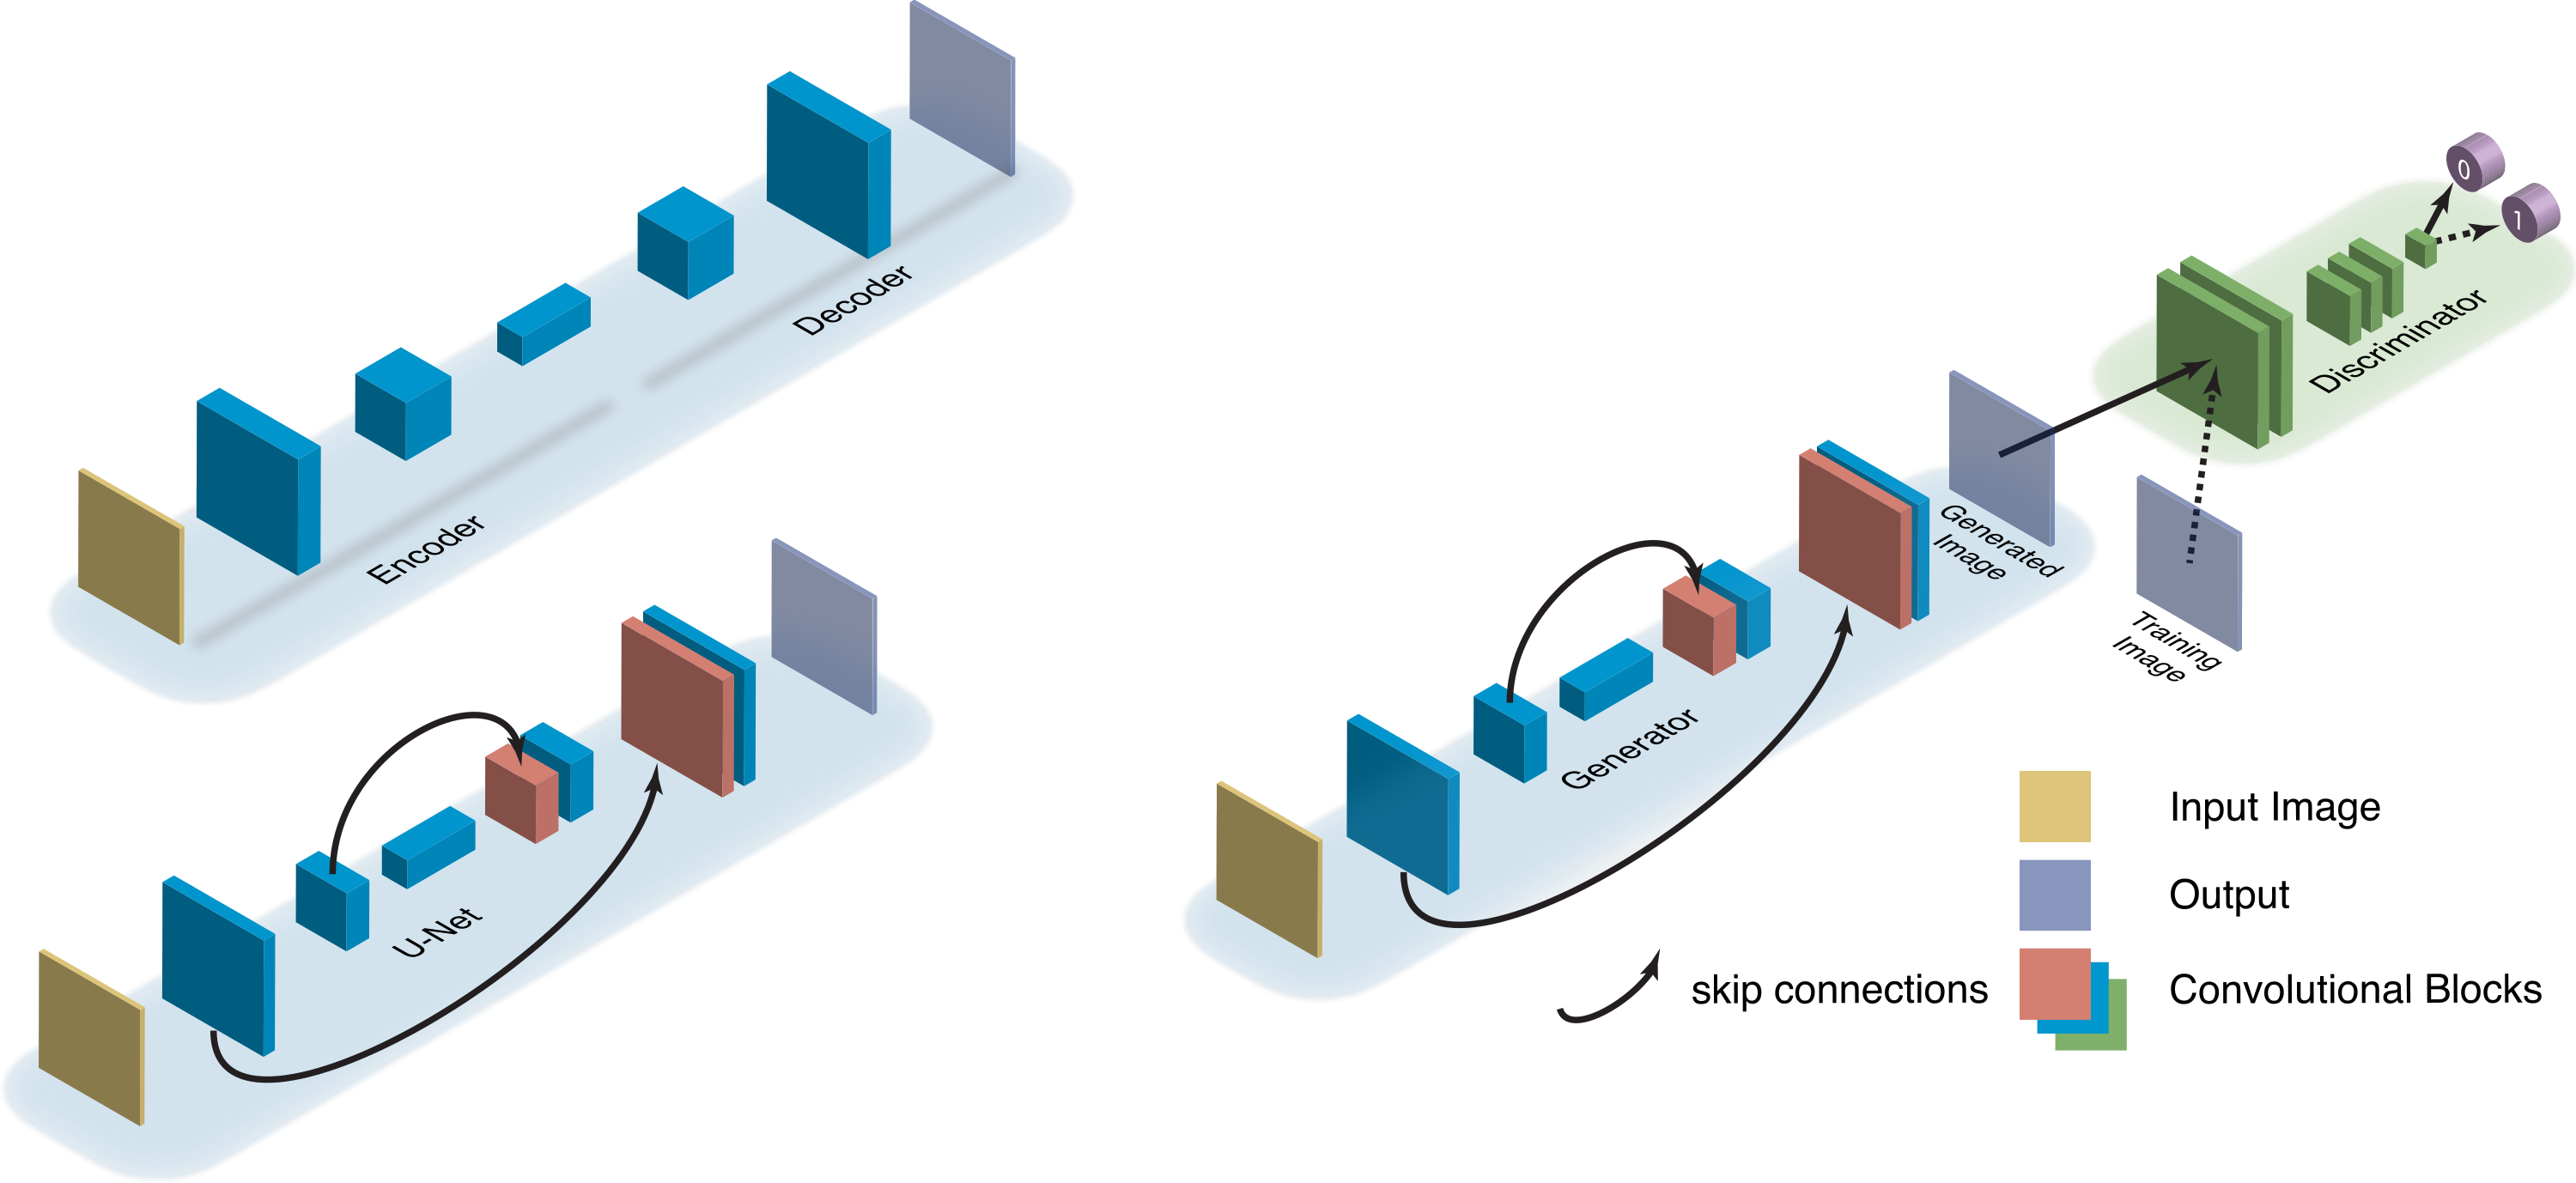
(Belthangady et al., 2019). Comparison of image-to-image translation networks. A U-Net builds on an encoder-decoder by adding skip connections between convolution blocks. A GAN builds on a generator by forcing its output to be indistinguishable from training samples.
Example: thispersondoesnotexist.com
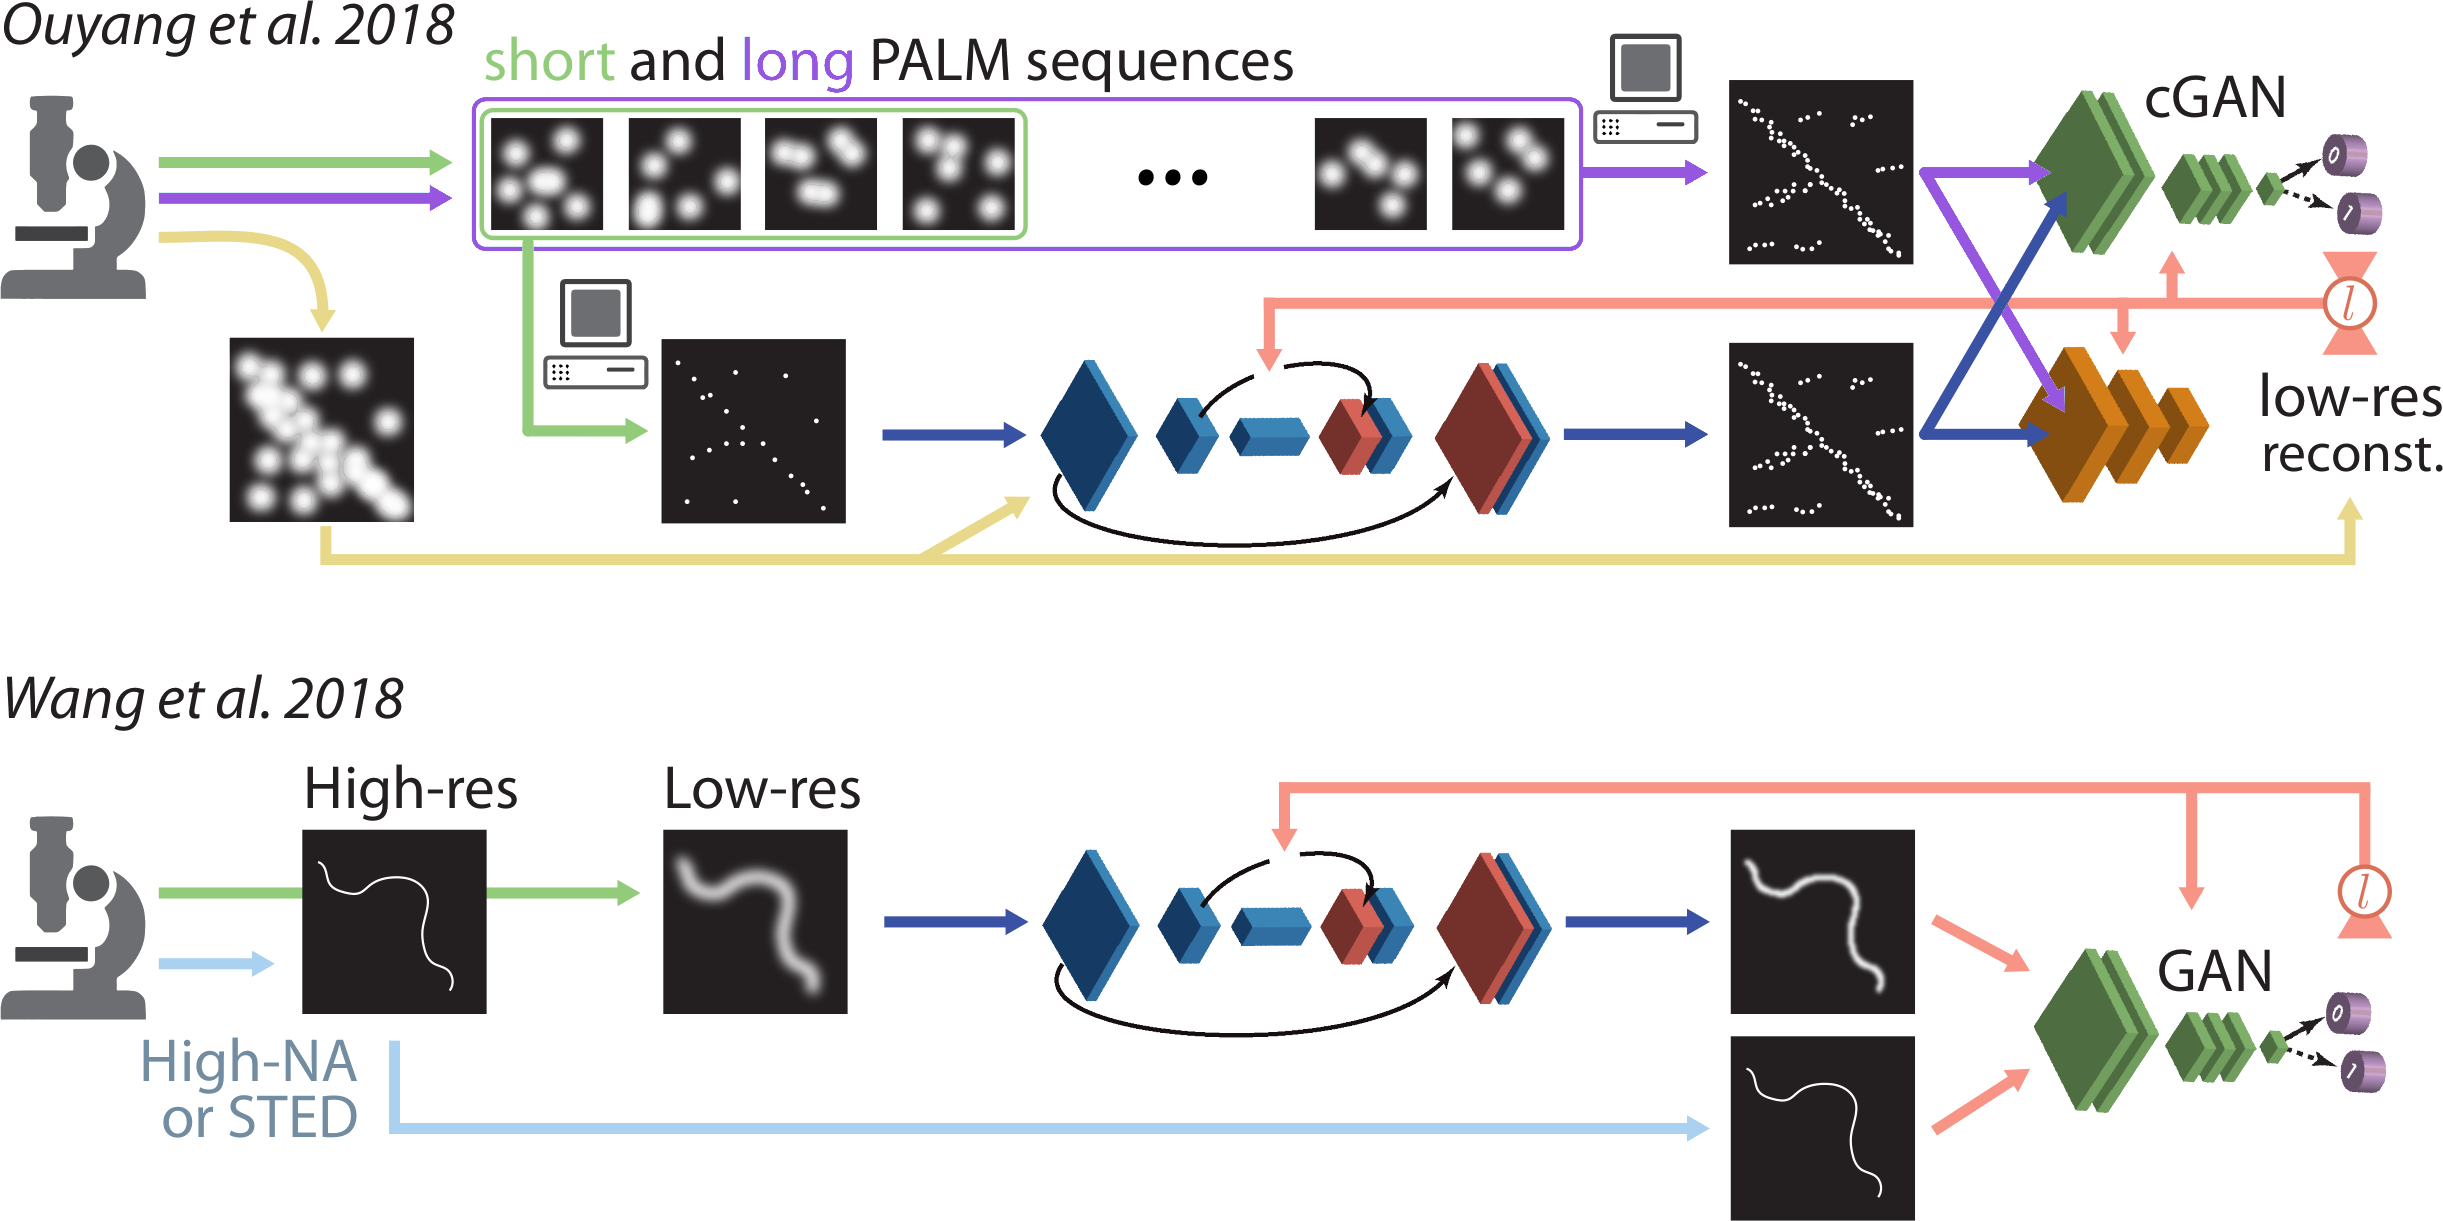
(Belthangady et al., 2019). Two superresolution approaches use GANs to force (fast) trainable network outputs to be indistinguishable from (slow) ground truth high-resolution computations.
Trust
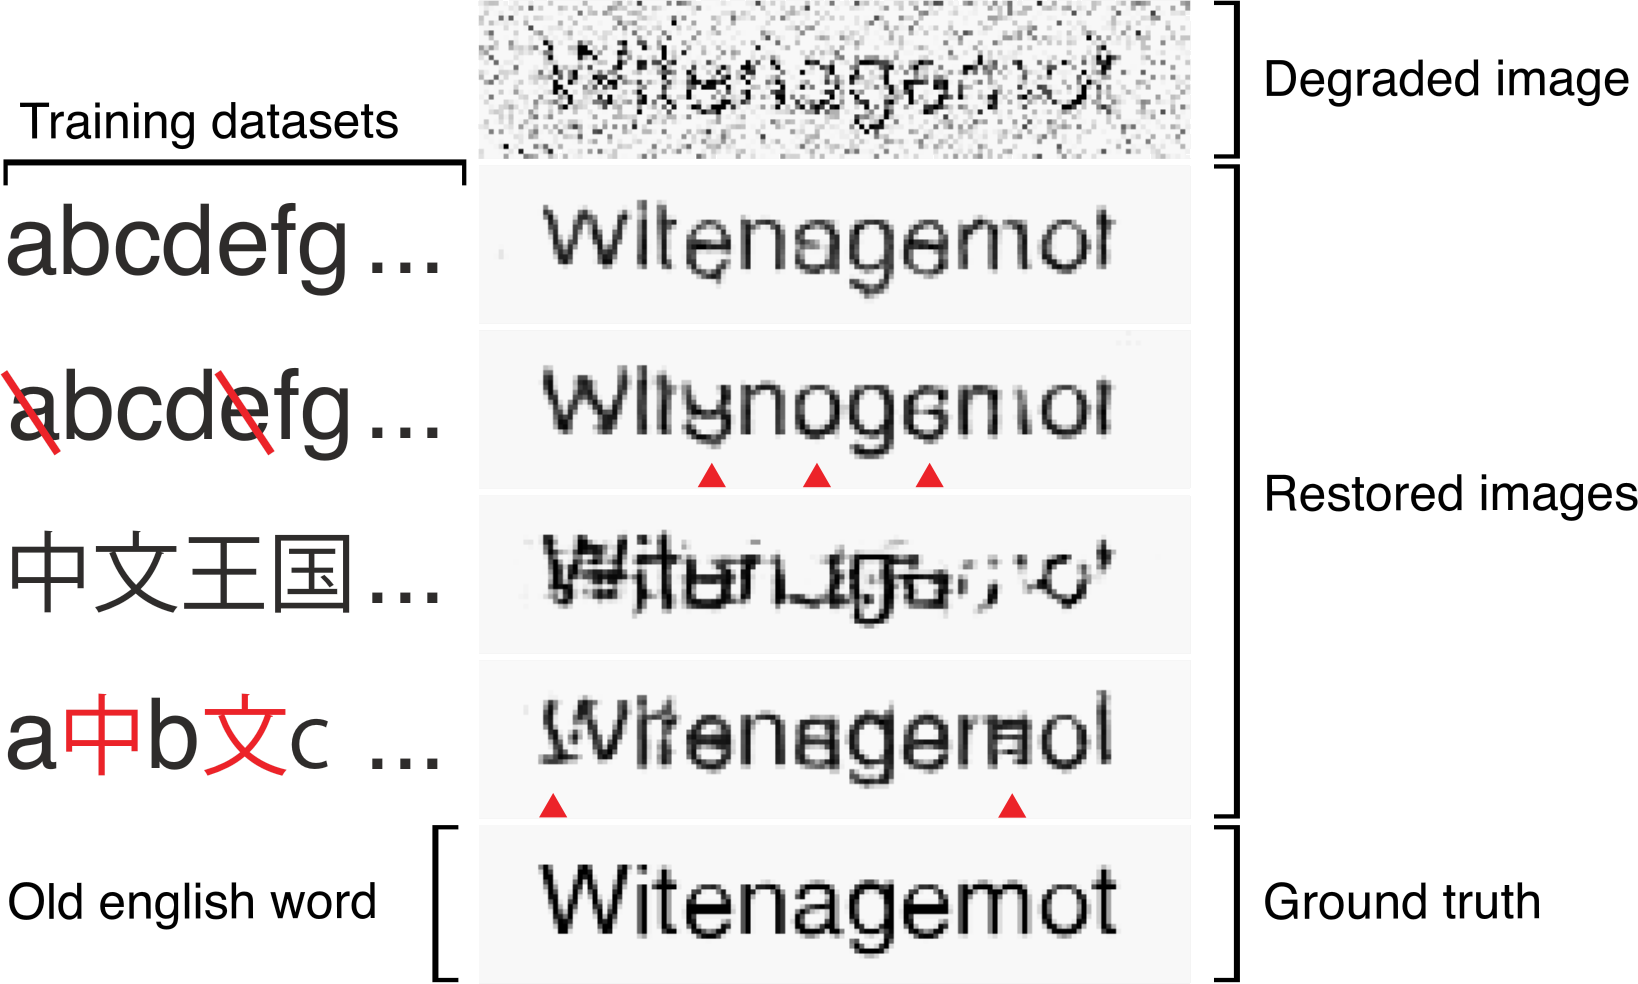
(Belthangady et al., 2019). Demonstration of the pitfalls of data-driven image restoration. An image of the word "Witenagemot" is restored by U-Nets trained on different datasets. Each network produces a visually-plausible answer, but only the one trained on the right dataset produces a correct answer.
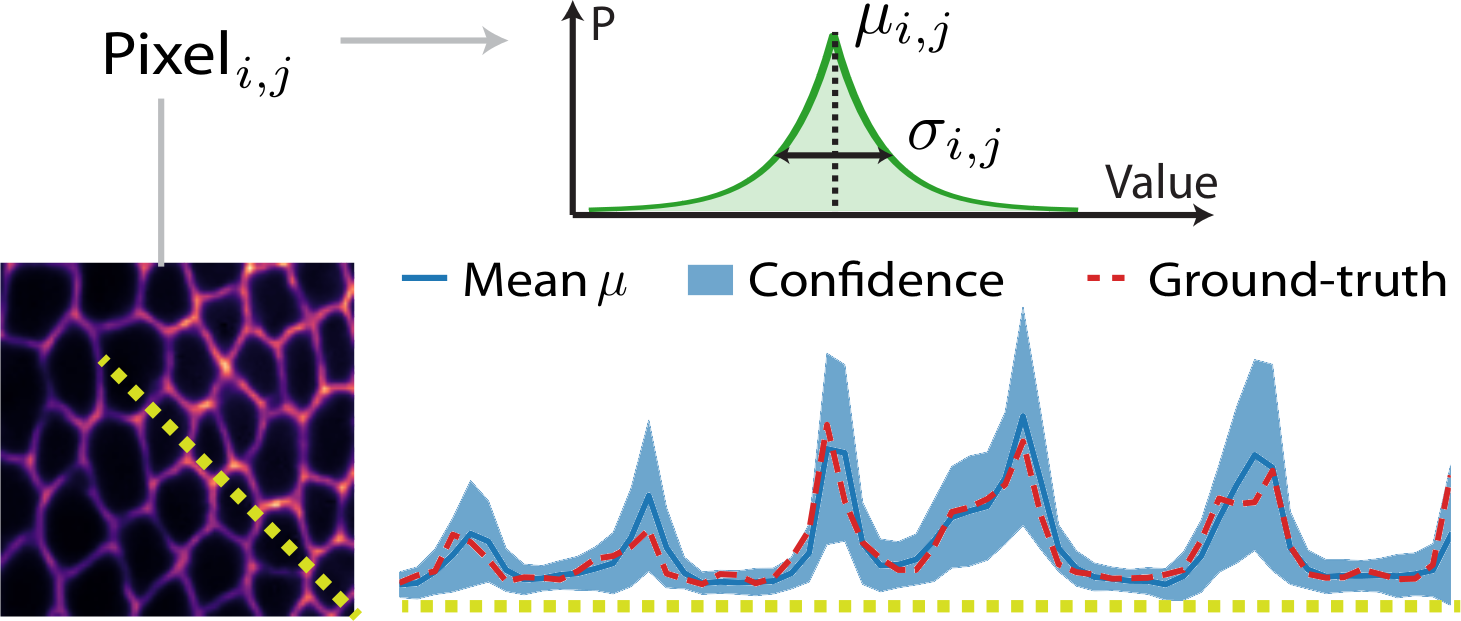
(Weigert et al., 2018). Predicting per-pixel probability distributions allows one to build pseudo-confidence intervals for network predictions. Here, even when ground-truth values differ from predictions, they fall within the predicted confidence interval. Still no guarantees the learned probability distributions converge to anything physical.
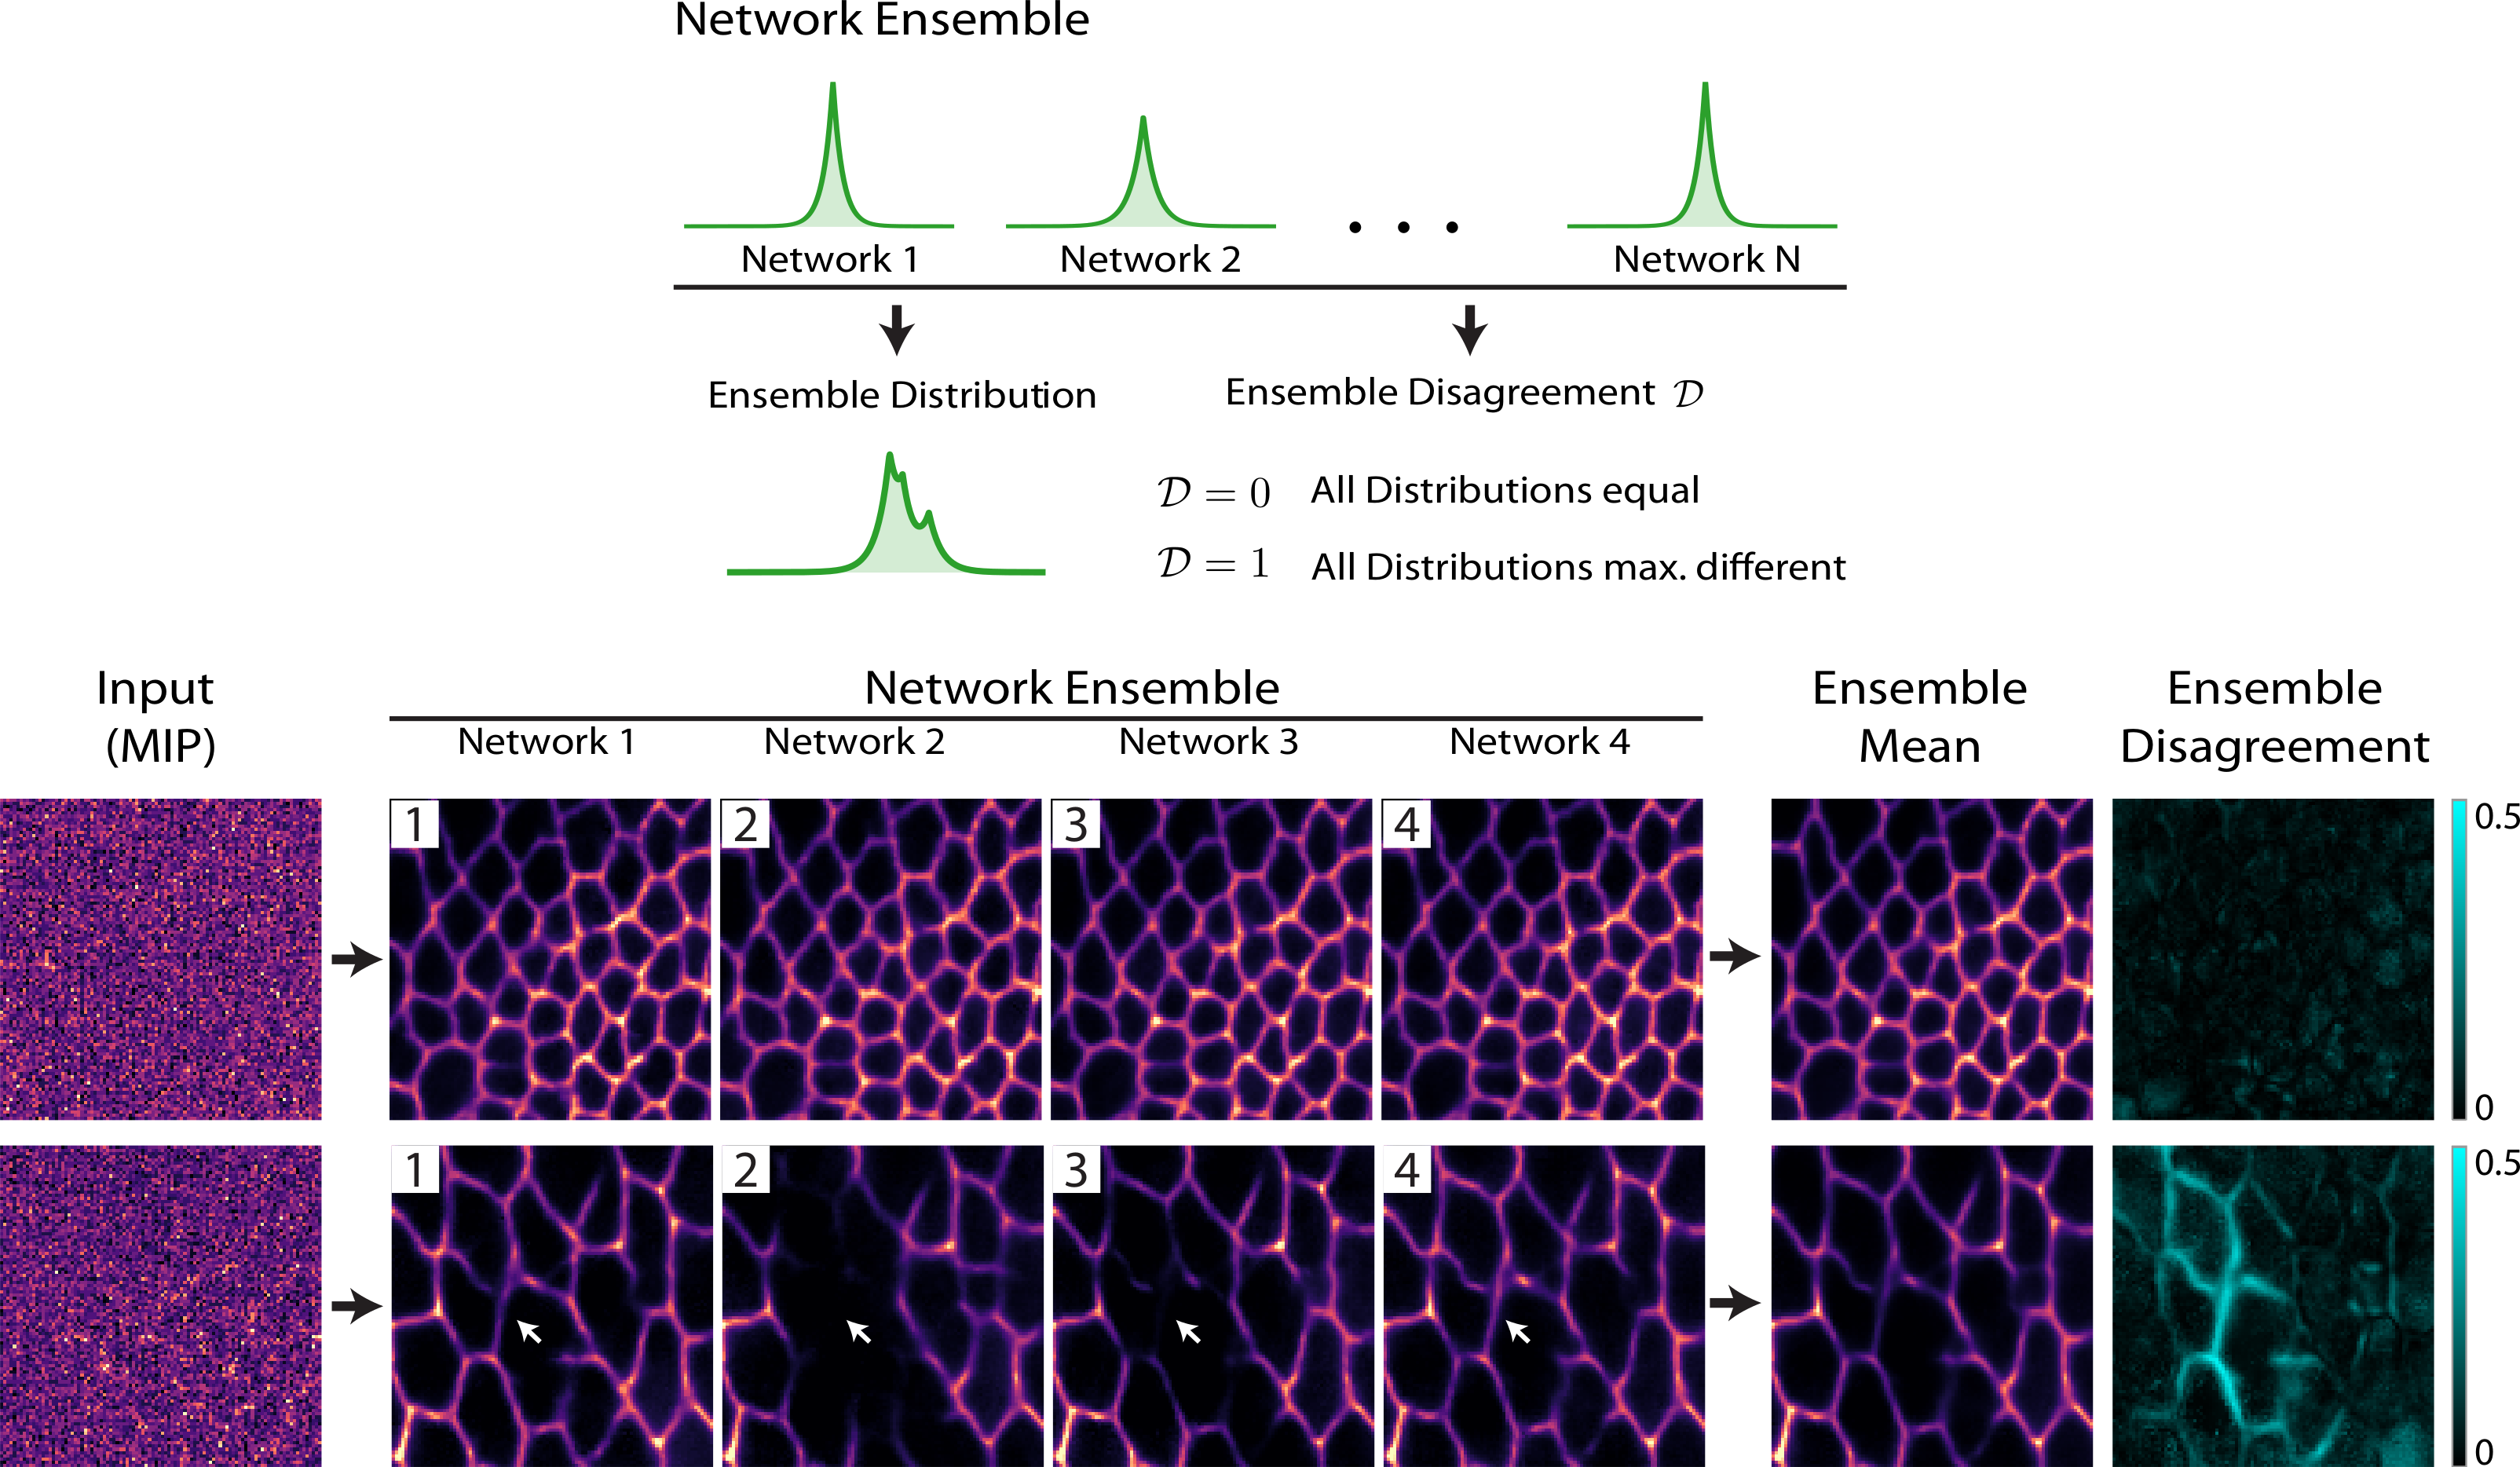
(Weigert et al., 2018). Using ensemble disagreement to measure prediction confidence.
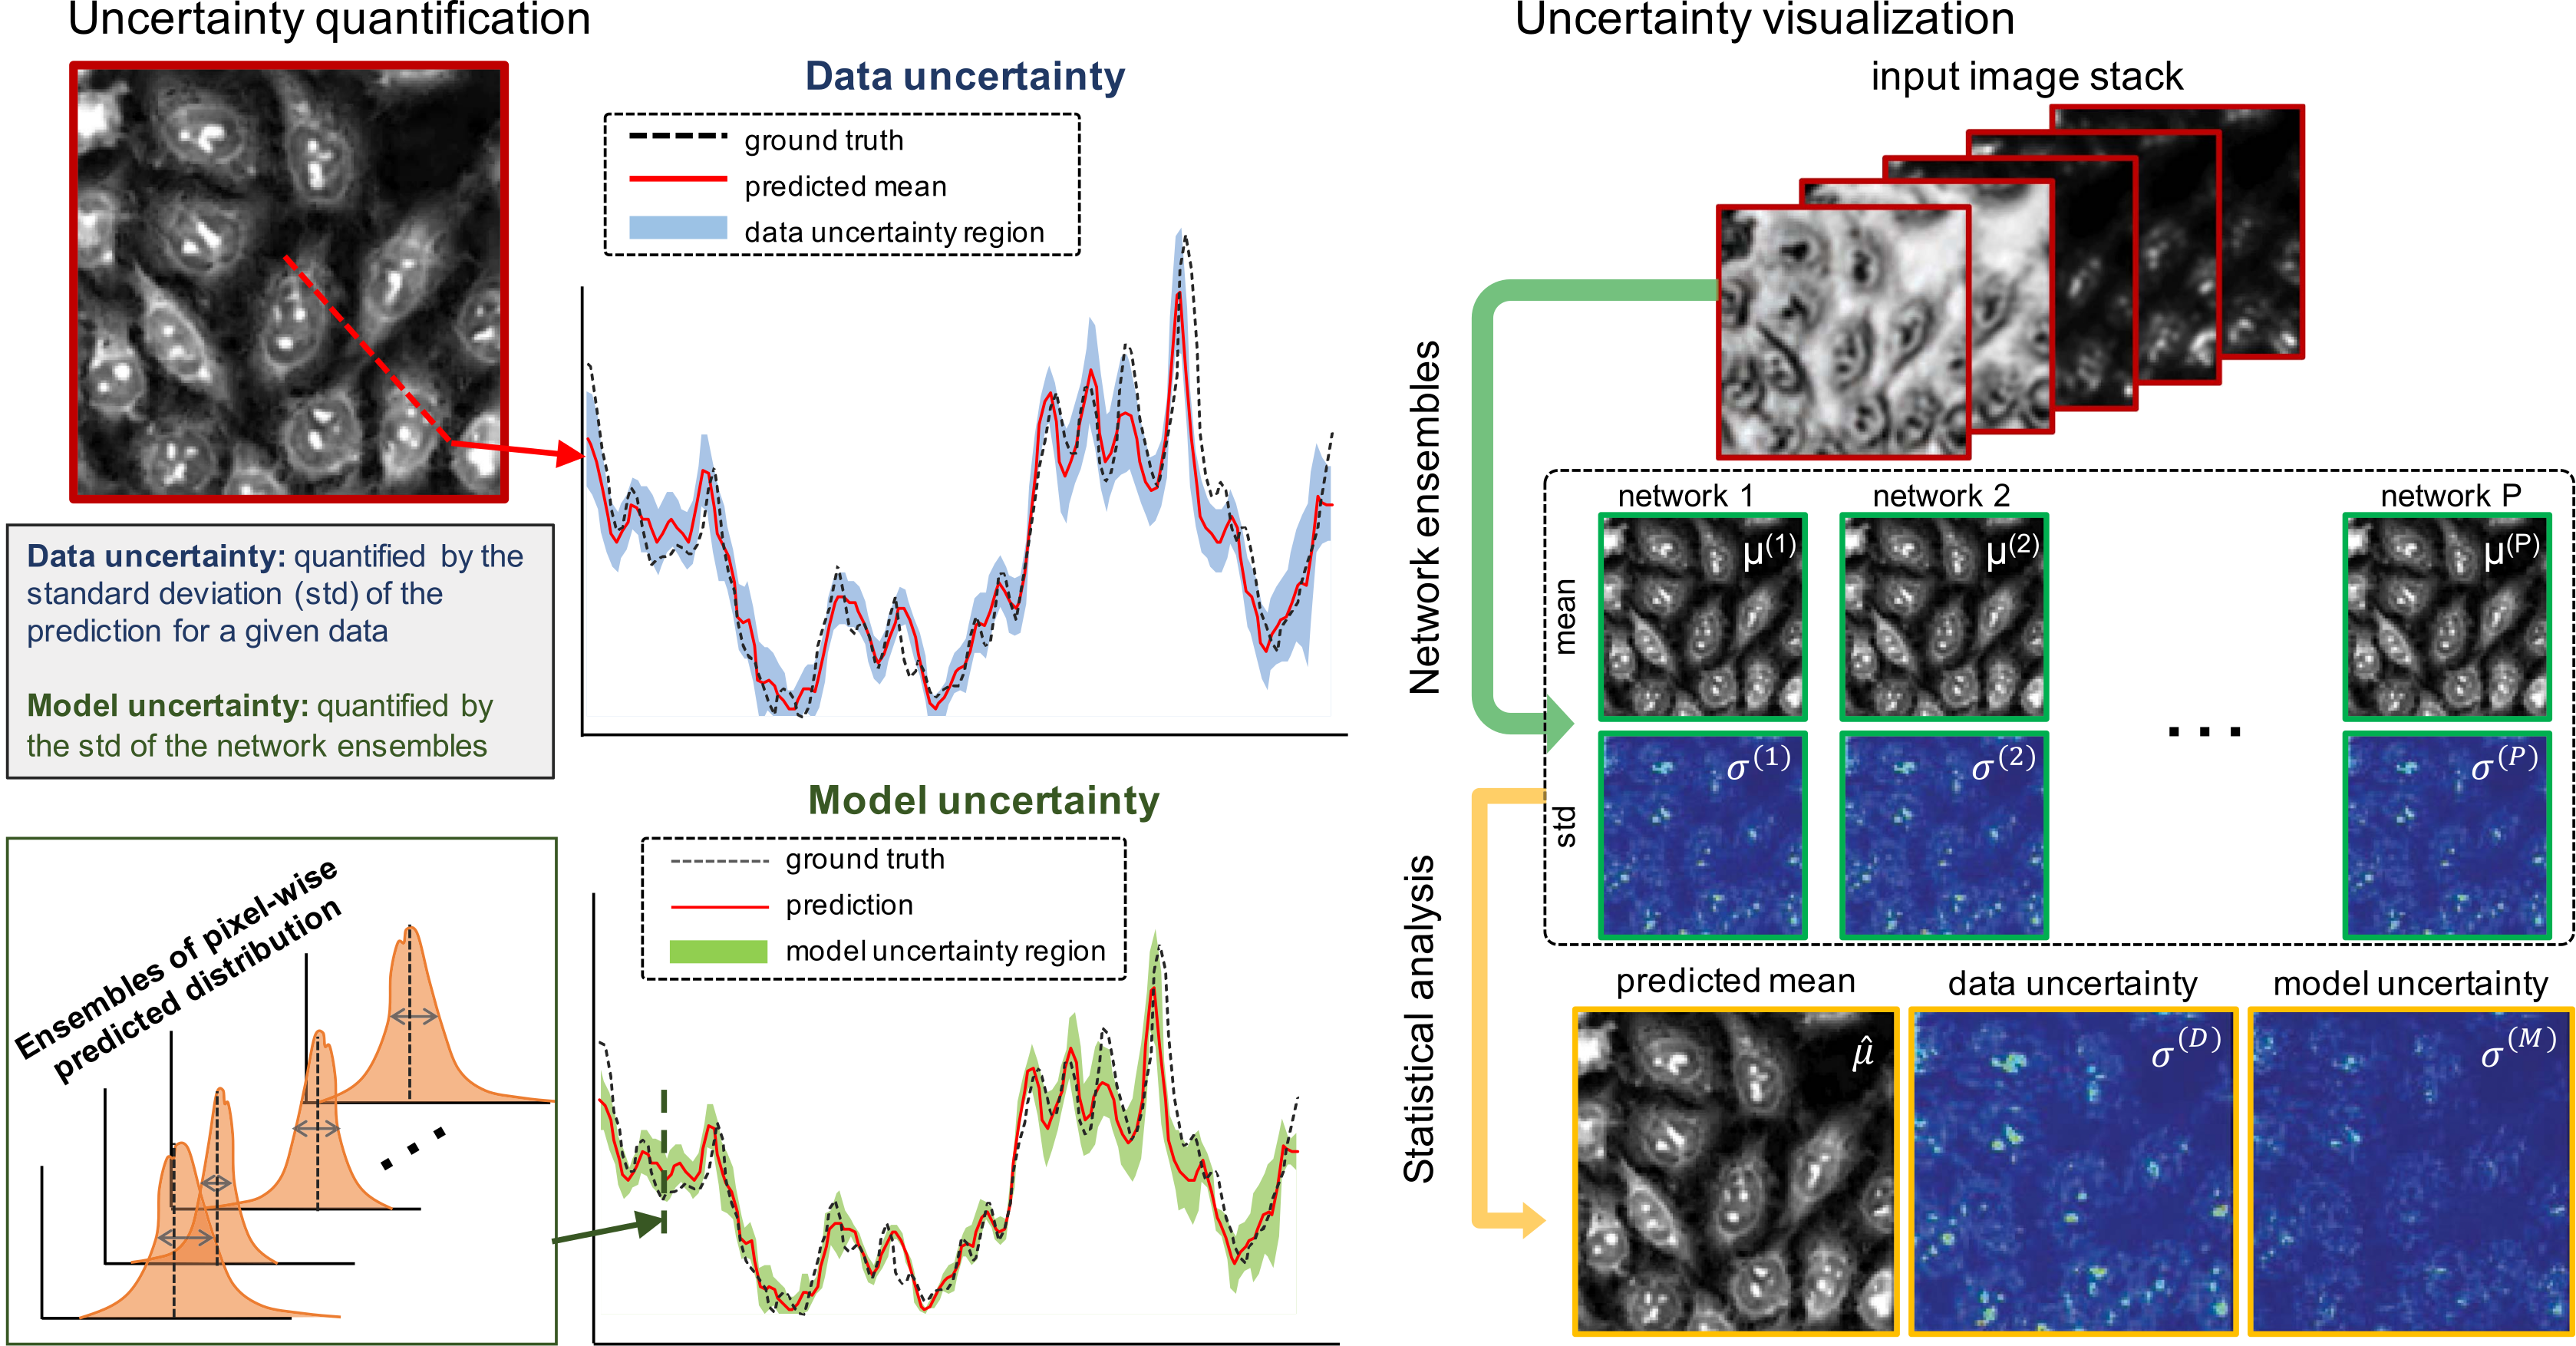
(Xue et al., 2019). The authors use ensembles of Bayesian CNNs to quantify uncertainty relative to the data and relative to the model.